Quantcast
Channel: Search Results for “shiny”– R-bloggers
Viewing all 673 articles
Browse latest View live

The R-Podcast Episode 16: Interview with Dean Attali

$
0
0

(This article was first published on The R-Podcast (Podcast), and kindly contributed to R-bloggers)

Direct from the first-ever Shiny Developer conference, here is episode 16 of the R-Podcast! In this episode I sit down with Dean Attali for an engaging conversation about his journey to using R, his motivation for creating the innovative shinyjs package, and his perspective on teaching others about R through his support of the innovative and highly-praised Stats 545 course at UBC. In addition you’ll hear about how his previous work prepared him well for using R, his collaboration with the RStudio team, and much more. I hope you enjoy this episode and thanks for listening!

Direct Download: [mp3 format] [ogg format]

Episode 16 Show Notes

Dean Attali (@daattali)

Package Pick

Feedback

  • Leave a comment on this episode’s post
  • Email the show: thercast[at]gmail.com
  • Use the R-Podcast contact page
  • Leave a voicemail at +1-269-849-9780

Music Credits

To leave a comment for the author, please follow the link and comment on their blog: The R-Podcast (Podcast).

R-bloggers.com offers daily e-mail updates about R news and tutorials on topics such as: Data science, Big Data, R jobs, visualization (ggplot2, Boxplots, maps, animation), programming (RStudio, Sweave, LaTeX, SQL, Eclipse, git, hadoop, Web Scraping) statistics (regression, PCA, time series, trading) and more...

Shiny Developer Conference

$
0
0

(This article was first published on R – Win-Vector Blog, and kindly contributed to R-bloggers)

Really enjoying RStudio‘s Shiny Developer Conference | Stanford University | January 2016.

Winston Chang just demonstrated profvis, really slick. You can profile code just by wrapping it in a profvis({}) block and the results are exported as interactive HTML widgets.

For example, running the R code below:

if(!('profvis' %in% rownames(installed.packages()))) {
  devtools::install_github('rstudio/profvis')
}
library('profvis')

nrow = 10000
ncol = 1000
data <- as.data.frame(matrix(rnorm(nrow*ncol),
                             nrow=nrow,ncol=ncol))

profvis({
  d <- data
  means <- apply(d,2,mean)
  for(i in seq_along(means)) {
    d[[i]] <- d[[i]] - means[[i]]
  }
})

Produces an interactive version of the following profile information:


Prof

Definitely check it out!

Many other great presentations, this one is just particularly easy to share.

To leave a comment for the author, please follow the link and comment on their blog: R – Win-Vector Blog.

R-bloggers.com offers daily e-mail updates about R news and tutorials on topics such as: Data science, Big Data, R jobs, visualization (ggplot2, Boxplots, maps, animation), programming (RStudio, Sweave, LaTeX, SQL, Eclipse, git, hadoop, Web Scraping) statistics (regression, PCA, time series, trading) and more...

Shiny Developers Conference Review

$
0
0

(This article was first published on Mango Solutions » R Blog, and kindly contributed to R-bloggers)

by Aimee Gott


shiny-developers-conference-1


Late in 2015 I was delighted to receive an invite to the inaugural Shiny Developers Conference to be held in Stanford, California. I didn’t have to think twice about wanting to be there and now that it is over I am delighted I got the invite and made the trip.


Joe Cheng did a great job in starting day 1 and making us all proficient users of reactive and observe functions, and more importantly when to use which (hint: you should always use reactive, except in the couple of cases when you shouldn’t). After lunch he was followed by Winston Chang who showed us linked brushing, Hadley Wickham who showed us shiny Gadgets and Jeff Allen who walked us through deployment options for shiny apps. If that all wasn’t enough we were further inspired by how others were using shiny in practice; I was particularly impressed by Ricardo Bion who talked to us about how AirBnB are using shiny for prototyping dashboards.


But it was definitely the gadgets that I wanted to try out in the coding time that followed. If you haven’t seen gadgets before these are essentially small shiny apps that can be built to help perform analysis, as opposed to presenting results of analysis. As with all things from RStudio it was really quick and easy to get started with and I was pleased to say that it only took me a couple of hours to go from never having touched gadgets to having a gadget in a package that integrated with the addins available in the beta version of the RStudio IDE.(Sorry to everyone at Mango who are now going to have to listen to me telling them “We should make a gadget for that” for everything).


All of this just from day 1, so how did day 2 compare? Well, somehow they managed to fit even more in to day 2.


Garrett talked us through shiny modules which are going to become an invaluable part of my app development, essentially meaning I don’t have to copy and paste parts of apps but call them like functions. Beyond that we saw debugging, dashboards and profiling from Jonathan McPherson, Nathan Stephens and Winston Chang. Garrett talked to us about UI and Yihui Xie talked through DT for DataTables. And yet there was more! More user talks. For me a highlight was shinyjs from Dean Attalli which allows you to incorporate javascript functionality into your apps.


I’m not quite sure how so much was crammed into just two days but I have certainly come out of the weekend with many, many new ideas and I can’t wait to put them into practice.


So a massive congratulations to Joe Cheng and all at RStudio on their successful conference, and watch this space for more on the gadgets, modules and shinyjs!

To leave a comment for the author, please follow the link and comment on their blog: Mango Solutions » R Blog.

R-bloggers.com offers daily e-mail updates about R news and tutorials on topics such as: Data science, Big Data, R jobs, visualization (ggplot2, Boxplots, maps, animation), programming (RStudio, Sweave, LaTeX, SQL, Eclipse, git, hadoop, Web Scraping) statistics (regression, PCA, time series, trading) and more...

Need any more reason to love R-Shiny? Here: you can even use Shiny to create simple games!

$
0
0

(This article was first published on Dean Attali's R Blog, and kindly contributed to R-bloggers)

TL;DR Click here to play a puzzle game written entirely in Shiny (source code).

Anyone who reads my blog posts knows by now that I’m very enthusiastic about Shiny (the web app framework for R – if you didn’t know what Shiny is then I suggest reading my previous post about it). One of my reasons for liking Shiny so much is that you can do so much more with it than what it was built for, and it’s fun to think of new useful uses for it. Well, my latest realization is that you can even make simple games quite easily, as the lightsouts package and its companion web app/game demonstrate! I’m actually currently on my way to San Francisco for the first ever Shiny conference, so this post comes at a great time.

First, some background. I was recently contacted by Daniel Barbosa who offered to hire me for a tiny project: write a solver for the Lights Out puzzle in R. After a few minutes of Googling I found out that Lights Out is just a simple puzzle game that can be solved mathematically. The game consists of a grid of lights that are either on or off, and clicking on any light will toggle it and its neighbours. The goal of the puzzle is to switch all the lights off.

Here is a simple visual that shows what happens when pressing a light on a 5×5 board:

Lights Out instructions

The cool thing about Lights Out is that, as I mentioned, it can be solved mathematically. In other words, given any Lights Out board, there are a few algorithms that can be used to find the set of lights that need to be clicked in order to turn all the lights off. So when Daniel asked me to implement a Lights Out solver in R, it really just meant to write a function that would take a Lights Out board as input (easily represented as a binary matrix with 0 = light off and 1 = light on) and implement the algorithm that would determine which lights to click on. It turns out that there are a few different methods to do this, and I chose the one that involves mostly linear algebra because it was the least confusing to me. (If you’re curious about the solving algorithm, you can view my code here.)

At the time of completing this solver function I was traveling but bedridden, so I thought “well, why not go the extra half mile and make a package out of this, so that the game is playable?”, which is exactly what I did. The next day, the lightsout package was born, and it was capable of letting users play a Lights Out game in the R console. You can see the README of the package to get more information on that.

At this point you can predict what happened next. “Why don’t I complete that mile and just write a small Shiny app that will use the gameplay logic from the package and wrap it in a graphical user interface? That way there’ll be an actual useful game, not just some 1980 text-based game that gives people nightmares.”

Since the game logic was already fully implemented, making a Shiny app that encapsulates the game logic was very easy. You can play the Shiny-based game online or by downloading the package and running lightsout::launch(). Here is a screenshot of the app:

Lights Out game

You can view the code for the Shiny app to convince yourself of how simple it is by looking in the package source code. It only took ~40 lines of Shiny UI code, ~100 lines of Shiny server code, a little bit of styling with CSS, and absolutely no JavaScript. Yep, the game was built entirely in R, with 0 JavaScript (although I did make heavy use of shinyjs).

While this “game” might not be very impressive, I think it’s still a nice accomplishment to know that it was fully developed in R-Shiny. More importantly, it serves as a simple proof-of-concept to show that Shiny can be leveraged to make simple web-based games if you already have the logic implemented in R.

Disclaimer: I realize this may not necessarily be super practical because R isn’t used for these kinds of applications, but if anyone ever writes a chess or connect4 or any similar logic game in R, then complementing it with a similar Shiny app might make sense.

To leave a comment for the author, please follow the link and comment on their blog: Dean Attali's R Blog.

R-bloggers.com offers daily e-mail updates about R news and tutorials on topics such as: Data science, Big Data, R jobs, visualization (ggplot2, Boxplots, maps, animation), programming (RStudio, Sweave, LaTeX, SQL, Eclipse, git, hadoop, Web Scraping) statistics (regression, PCA, time series, trading) and more...

R Tagosphere!

$
0
0

(This article was first published on R – AmitKohli.com, and kindly contributed to R-bloggers)

This post explores the inter-relationships of StackOverflow Tags for R-related questions. So I grabbed all the questions tagged with “r”, took the other tags in each question and made some network charts that show how often each tag is seen with the other tags. The point is to see the empirical relationships that develop as people organically describe their problems with R. Full analysis on GitHub, as always.

<newbie> For the non-techies out there: StackOverflow.com is a question and answer website which many techies LOVE because in many cases it’s the best place to get answers when you’re stuck… I’ve used it a bunch of times. When you ask a question, you can tag it with (mostly) pre-defined “Tags” that help experts find your question. For example, I might ask a question: “How can I sum three numbers in Excel?”. In this case, I’d be smart to add the tags: Excel and Formula. This will help Excel and Formula experts to find my question and answer it quickly. Anyway, StackOverflow (or SO) is this whole thing, check it out… it’s awesome. 

What I did was harvest all the questions regarding the stats program R, and then took all the other tags in that question and showed the relationships between these tags. </newbie>

Aaaaaaaaaaaaaaanyway:

Using the tremendously awesome SO Data Explorer which lets you query the entire SO question corpus, I found a query close enough to what I wanted and downloaded all the questions that had the tag “r”. A little manipulation and I’m ready to plot the relationships! But plot what? I can imagine that the tag ggplot2 would often be related to the tag  plot  so there should be a connection there… but should that count as much as a one-off random relationship? In order to answer this, we count how many times we saw the relationship, and call it the Link Strength (LS). So tags that are very frequently linked together will have a very high LS, and the one-off will have a low LS.

Jumping right to it, BOOM! Here is LS=10 (this will only show tags as related if they were seen together more than 10 times) :

Simple10


>>Play with the interactive version though<<, it’s WAAAAAAAAAAAAAAY funner (by the way, Ctrl+F works on it :)). Here it is in an ugly iframe:


Two problems with this one:

  1. It’s not possible to distinguish the strong links (with high LS) from the weak links
  2. Those “floaters” that you see in the peripheries might be related to the central network… the link might just be seen less than 10 times.

OK, so let’s take a step back and figure out the LinkStrengthLS for all tag-pairs. Plotting that, we see that the link strength increases very slowly (see figure to the right-top, and a blowup of the “elbow” right-bottom). As can be seen, around 6000 of our 7000ish tag-pairs have a LS <10.

CONCLUSION 1: Most tag relationships are seen less than 10 times, which shows the LinkStrengthBlowuphuge heterogeneity of the questions of the r user community.


To investigate further, let’s plot charts at LS= 1, 10, 100, where the LS is the thickness of each link (thicker is higher Link Strength). To accomplish this I used the ForceNetwork rather than the SimpleNetwork functions of the D3Network package (yes I know the new one is called network3d but I haven’t installed it yet, sue me). Oh, and these charts are zoom and scroll enabled, so enjoy the interactive versions here: LS=1, LS = 10, LS = 100. They are way better to navigate. Hover your mouse over each node to see the tag name.

Complex1 Complex10 Complex100

So. considering that the LS variability is mostly very low  (which is what we saw on the LS  point charts above anyway), I’m going to go out on a limb and say that the Link Strength per se is an interesting but perhaps unnecessary visualization element… it seems like the number of links to other nodes is more important. Therefore:

Conclusion 2: Tag popularity (as relates to R) is best predicted by how “central” a node is, not by the LS of its connections to other nodes. Here, centrality is used as a proxy to describe how many OTHER Tags it’s connected to. I could count them, but meh… you do it.

Conclusion

I think that Network charts are a great way of exploring the relationships between tags. These relationships, when mapped together somehow show how we all use our beloved r. For example, in the LS=10 chart I provided, you can see the following topical “arms”: machine learning, packages, knitr, xml, sql, shiny, rstudio, regex, etc, all with a bunch of tags within each arm. You’ve also got the messy internal cluster tags that are linked to by EVERYONE… these are the r staples.

Anyway, These network charts can also be used to investigate new tags that might be interesting to users that consider themselves specialists in a specific area.

It’s a bit tricky to figure out the best LS to visualize… I like 10… but feel free to play around. I also started playing around with a method of identifying specific tags to explore… it’s in the R-script… it’s not great but might be a good start… check it out if interested.

This analysis could be used for any tag. I chose “r”, but it’s easy to see how to change the query to get all the questions for any other tag too… check out the script.

A gift for everyone!

So this is just the tip of this analysis. I’ve made a csv with just the Link Strengths for each pair of tags (oh, its 500 megs… extract it yourself from the R code)… it can be found in the GitHub repo. Of course while you’re there and you might find out that the initial query from SO has more than just the tagnames for each question… go crazy internets!

A gift for rich people

OK fine you rich bastards… you have a computer that can handle big data and a 4k monitor? Enjoy the full_pawwah of the complete network (LS>1), plotted using the Simple technique which will have all teh names etc, at 4k rez. I hope you choke.

(edited by Laure Belotti)

To leave a comment for the author, please follow the link and comment on their blog: R – AmitKohli.com.

R-bloggers.com offers daily e-mail updates about R news and tutorials on topics such as: Data science, Big Data, R jobs, visualization (ggplot2, Boxplots, maps, animation), programming (RStudio, Sweave, LaTeX, SQL, Eclipse, git, hadoop, Web Scraping) statistics (regression, PCA, time series, trading) and more...

The R-Podcast Episode 17: A Simply Radiant Chat with Vincent Nijs

$
0
0

(This article was first published on The R-Podcast (Podcast), and kindly contributed to R-bloggers)

The R-Podcast continues its series on Shiny and the first-ever Shiny Developer Conference by catching up with Vincent Nijs, associate professor of marketing at UC San Diego and one of the earliest adopters of Shiny. Some of the topics we cover include his journey to using R, his motivation and process for developing the Radiant Shiny application used by his students to perform business analytics, and how he would like to involve the community to add new capabilities to Radiant. I hope you enjoy this episode and thanks for listening!

Direct Download: [mp3 format] [ogg format]

Episode 17 Show Notes

Feedback

  • Leave a comment on this episode’s post
  • Email the show: thercast[at]gmail.com
  • Use the R-Podcast contact page
  • Leave a voicemail at +1-269-849-9780

Music Credits

To leave a comment for the author, please follow the link and comment on their blog: The R-Podcast (Podcast).

R-bloggers.com offers daily e-mail updates about R news and tutorials on topics such as: Data science, Big Data, R jobs, visualization (ggplot2, Boxplots, maps, animation), programming (RStudio, Sweave, LaTeX, SQL, Eclipse, git, hadoop, Web Scraping) statistics (regression, PCA, time series, trading) and more...

Using Microsoft R Open with RStudio

$
0
0

(This article was first published on Revolutions, and kindly contributed to R-bloggers)

by Joseph Rickert

A frequent question that we get here at Microsoft about MRO (Microsoft R Open) is: can be used with RStudio? The short answer is absolutely yes! In fact, more than just being compatible, MRO is the perfect complement for the RStudio environment. MRO is a downstream distribution of open source R that supports multiple operating systems and provides features that enhance the performance and reproducible use of the R language.  RStudio, being much more than a simple IDE, provides several features such as the tight integration knitr, RMarkdown and Shiny that promote literate programming, the creation of reproducible code as well as sharing and collaboration. Together, MRO and RStudio they make a powerful combination. Before elaborating on this theme, I should just make it clear how to select MRO from the RStudio IDE. After you have installed MRO on your system, open RStudio, go to the "Tools" tab at the top, and select "Global Options". You should see a couple of pop-up windows like the screen capture below. If RStudio is not already pointing to MRO (like it is in the screen capture) browse to it, and click "OK".

  RStudio

One feature of MRO that dovetails nicely with RStudio is that way that MRO is tied to a fixed repository. Every day, at precisely midnight UTC, the infrastructure that supports the MRO distribution takes a snapshot of CRAN and stores it on Microsoft’s MRAN site. (You can browse through the snapshots back to September 17, 2014 from the CRAN Time Machine.) Each MRO release is pre-configured to point to a particular CRAN snapshot. MRO 3.2.3, for example, points to CRAN as it was on January 1, 2016. Everyone who downloads MRO is guaranteed to start from a common baseline that reflects CRAN and all of its packages as they existed at a particular point in time. This provides an enormous advantage for corporations and collaborating teams of R programmers who can be sure that they are at least starting off on the same page, all working with the same CRAN release and a consistent view of the universe of R packages.

However, introducing the discipline of a fixed repository into the RStudio workflow is not completely frictionless. Occasionally, the stars don’t line up perfectly and an RStudio user, or any other user that needs a particular version of a CRAN package for some reason, may have to take some action. For example, I recently downloaded MRO 3.2.3, fired up RStudio and thought “sure why not” when reminded that a newer version of RStudio was available. Then, I clicked to create a new rmarkdown file and was immediately startled by an error message that said that the available rmarkdown package was not the version required by RStudio. The easy fix, of course, was to point to a repository containing a more recent version of rmarkdown than the one associated with the default snapshot date. If this happens to you, either of the following will take care of things:        

To get the latest version of the  markdown package, use:
install.packages("rmarkdown", repos = "https://cran.revolutionanalytics.com")

To get the 0.9.2 version of the  markdown package, use:
install.packages("rmarkdown", repos = "https://mran.revolutionanalytics.com/snapshot/2016-01-02")

Apparently, by chance, we missed setting a snapshot date for MRO that would be convenient for RStudio users by one day,

A second way that MRO fits into RStudio is the way that the checkpoint package, which installs with MRO, can enhance the reproducibility power of RStudio’s project directory structure. If you choose a new directory when set up a new Rstudio project, and then run the checkpoint() function from that project, checkpoint will set up a local repository in a subdirectory of the project directory. For example, executing the following two lines of code from a script in the MyProject directory will install all packages required by your project as they were at midnight UTC on the specified date. 

library(checkpoint)
checkpoint("2016-01-29")

Versions of all of the packages that are called out by scripts in your MyProject directory that existed on CRAN on January 29, 2016 will be installed in a subfolder of MyProject underneath ~/.checkpoint. Unless you use the same checkpoint date for other projects, the packages for MyProject will be independent of packages installed for those other projects. This kind of project specific structure is very helpful for keeping things straight. It provides a reproducibility code sharing layer on top of (or maybe underneath) RStudio's GitHub integration and other reproducibility features. When you want to share code with a colleague they don't need to manually install all of the packages ahead of time. Just have them clone your GitHub repository or put your code into their own RStudio project in some other way and then have them run checkpoint() from there. Checkpoint will search through the scripts in their project and install the versions of the packages they need.

Finally, I should mention that MRO can enhance any project by providing multi-threaded processing to the code underlying many of the R functions you will be using. R functions that make use of linear algebra operations under the hood such as matrix multiplication of Choleesky decompositions etc. will get a considerable performance boost. (Look here for some benchmarks.) For Linux and Windows platforms users can enable multi-threaded processing by downloading and Installing the Intel Math Kernel Libraries (MKL) when they install MRO from the MRAN site. Mac OS X users automatically get multithreading because MRO comes pre-configured to use the Mac Accelerate Framework.

Let us know if you use RStudio with MRO.

To leave a comment for the author, please follow the link and comment on their blog: Revolutions.

R-bloggers.com offers daily e-mail updates about R news and tutorials on topics such as: Data science, Big Data, R jobs, visualization (ggplot2, Boxplots, maps, animation), programming (RStudio, Sweave, LaTeX, SQL, Eclipse, git, hadoop, Web Scraping) statistics (regression, PCA, time series, trading) and more...

Free video course: applied Bayesian A/B testing in R

$
0
0

(This article was first published on R – Win-Vector Blog, and kindly contributed to R-bloggers)

As a “thank you” to our blog, mailing list, and Twitter followers (@WinVectorLLC) we at Win-Vector LLC have decided to re-release our formerly fee-based A/B testing video course as a free (advertisement supported) video course here on Youtube.


CTvideoCourse

The course emphasizes how to design A/B tests using prior “guestimates” of effect sizes (often you have these from prior campaigns, or somebody claims an effect size and it is merely your job to confirm it). It is fairly technical, and the emphasis is Bayesian- where we are trying to get an actual estimate of the distribution unknown true expected payoff rate of the various campaigns (the so-called posteriors). We show how to design and evaluate a sales campaigns for a product at two different price points.

The solution is coded in R and Nina Zumel has contributed an updated Shiny user interface demonstrating the technique (for more on Shiny, please see here). The code for the calculation methods and older shiny app are shared here.

This sort of fills out our survey of ways to think about A/B testing:

We have a lot more material on statistics and data science (though not on A/B testing) in our book and our paid video course Introduction to Data Science.

To leave a comment for the author, please follow the link and comment on their blog: R – Win-Vector Blog.

R-bloggers.com offers daily e-mail updates about R news and tutorials on topics such as: Data science, Big Data, R jobs, visualization (ggplot2, Boxplots, maps, animation), programming (RStudio, Sweave, LaTeX, SQL, Eclipse, git, hadoop, Web Scraping) statistics (regression, PCA, time series, trading) and more...

Cricket analytics with cricketr in paperback and Kindle versions

$
0
0

(This article was first published on R – Giga thoughts …, and kindly contributed to R-bloggers)

Untitled

My book “Cricket analytics with cricketr” is now available in paperback and Kindle versions. The paperback is available from Amazon (US, UK and Europe) for $ 48.99. The Kindle version can be downloaded from the Kindle store for $2.50 (Rs 169/-). Do pick your copy. It should be a good read for a Sunday afternoon.

This book of mine contains my posts based on my R package ‘cricketr’ now in CRAN. The package cricketr can analyze both batsmen and bowlers for all formats of the game Test, ODI and Twenty20. The package uses the data from ESPN Cricinfo. The analyses include runs frequency charts, performances of batsmen and bowlers in different grounds and against different teams, moving  average of  runs/wickets over the career, mean strike rate, mean economy rate and so on.

The book includes the following chapters based on my R package cricketr  There are 2 additional articles where I use Machine Learning with the package Octave.

CONTENTS
Cricket Analytics with cricketr 11
1.1. Introducing cricketr! : An R package to analyze performances of cricketers 11
1.2. Taking cricketr for a spin – Part 1 49
1.2. cricketr digs the Ashes! 70
1.3. cricketr plays the ODIs! 99
1.4. cricketr adapts to the Twenty20 International! 141
1.5. Sixer – R package cricketr’s new Shiny avatar 170
2. Other cricket posts in R 180
2.1. Analyzing cricket’s batting legends – Through the mirage with R 180
2.2. Mirror, mirror … the best batsman of them all? 206
3. Appendix 220
Cricket analysis with Machine Learning using Octave 220
3.1. Informed choices through Machine Learning – Analyzing Kohli, Tendulkar and Dravid 221
3.2. Informed choices through Machine Learning-2 Pitting together Kumble, Kapil, Chandra 234
Further reading 248
Important Links 249

I do hope you have a great time reading it. Do pick up your copy. Feel free to get in touch with me with your comments and suggestions.  I have more interesting things lined up for the future.

Watch this space!

You may also like
1. Literacy in India : A deepR dive.
2. Natural Language Processing: What would Shakespeare say?
3. Revisiting crimes against women in India
4. Experiments with deblurring using OpenCV
5. TWS-4: Gossip protocol: Epidemics and rumors to the rescue
6. Bend it like Bluemix, MongoDB with autoscaling – Part 1
7. “Is it animal? Is it an insect?” in Android

To leave a comment for the author, please follow the link and comment on their blog: R – Giga thoughts ….

R-bloggers.com offers daily e-mail updates about R news and tutorials on topics such as: Data science, Big Data, R jobs, visualization (ggplot2, Boxplots, maps, animation), programming (RStudio, Sweave, LaTeX, SQL, Eclipse, git, hadoop, Web Scraping) statistics (regression, PCA, time series, trading) and more...

Shiny Developer Conference 2016 Recap

$
0
0

(This article was first published on Getting Genetics Done, and kindly contributed to R-bloggers)
This is a guest post from VP Nagraj, a data scientist embedded within UVA’s Health Sciences Library, who runs our Data Analysis Support Hub (DASH) service.

Last weekend I was fortunate enough to be able to participate in the first ever Shiny Developer Conference hosted by RStudio at Stanford University. I’ve built a handful of apps, and have taught an introductory workshop on Shiny. In spite of that, almost all of the presentations de-mystified at least one aspect of the how, why or so what of the framework. Here’s a recap of what resonated with me, as well as some code and links out to my attempts to put what I digested into practice.

tl;dr

  • reactivity is a beast
  • javascript isn’t cheating
  • there are already a ton of shiny features … and more on the way

reactivity

For me, understanding reactivity has been one of the biggest challenges to using Shiny … or at least to using Shiny well. But after > 3 hours of an extensive (and really clear) presentation by Joe Cheng, I think I’m finally starting to see what I’ve been missing. Here’s something in particular that stuck out to me:
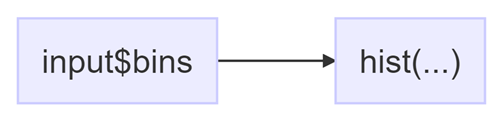
output$plot = renderPlot() is not an imperative to the browser to do a what … it’s a recipe for how the browser should do something.
Shiny ‘render’ functions (e.g. renderPlot(), renderText(), etc) inherently depend on reactivity. What the point above emphasizes is that assignments to a reactive expression are not the same as assignments made in “regular” R programming. Reactive outputs depend on inputs, and subsequently change as those inputs are manipulated.
If you want to watch how those changes happen in your own app, try adding options(shiny.reactlog=TRUE) to the top of your server script. When you run the app in a browser and press COMMAND + F3 (or CTRL + F3 on Windows) you’ll see a force directed network that outlines the connections between inputs and outputs.
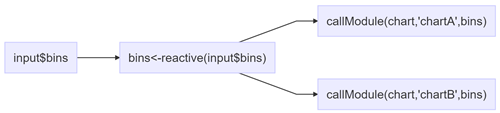
Another way to implement reactivity is with the reactive() function.
For my apps, one of the pitfalls has been re-running the same code multiple times. That’s a perfect use-case for reactivity outside of the render functions.
Here’s a trivial example:
library(shiny)

ui = fluidPage(
numericInput("threshold", "mpg threshold", value = 20),
plotOutput("size"),
textOutput("names")
)

server = function(input, output) {

output$size = renderPlot({

dat = subset(mtcars, mpg > input$threshold)
hist(dat$wt)

})

output$names = renderText({

dat = subset(mtcars, mpg > input$threshold)
rownames(dat)

})
}

shinyApp(ui = ui, server = server)
The code above works … but it’s redundant. There’s no need to calculate the “dat” object separately in each render function.
The code below does the same thing but stores “dat” in a reactive that is only calculated once.
library(shiny)

ui = fluidPage(
numericInput("threshold", "mpg threshold", value = 20),
plotOutput("size"),
textOutput("names")
)

server = function(input, output) {

dat = reactive({

subset(mtcars, mpg > input$threshold)

})

output$size = renderPlot({

hist(dat()$wt)

})

output$names = renderText({

rownames(dat())

})
}

shinyApp(ui = ui, server = server)

javascript

For whatever reason I’ve been stuck on the idea that using JavaScript inside a Shiny app would be “cheating”. But Shiny is actually well equipped for extensions with JavaScript libraries. Several of the speakers leaned in on this idea. Yihui Xie presented on the DT package, which is an interface to use features like client-side filtering from the DataTables library. And Dean Attali demonstrated shinyjs, a package that makes it really easy to incorporate JavaScript operations.
Below is code for a masterpiece that that does some hide() and show():
# https://apps.bioconnector.virginia.edu/game
library(shiny)
library(shinyjs)
shinyApp(

ui = fluidPage(
titlePanel(actionButton("start", "start the game")),
useShinyjs(),
hidden(actionButton("restart", "restart the game")),
tags$h3(hidden(textOutput("game_over")))
),

server = function(input, output) {

output$game_over =
renderText({
"game over, man ... game over"
})

observeEvent(input$start, {

show("game_over", anim = TRUE, animType = "fade")
hide("start")
show("restart")
})

observeEvent(input$restart, {
hide("game_over")
hide("restart")
show("start")
})

}
)

everything else

brushing

Adding a brush argument to plotOutput() let’s you click and drag to select a points on a plot. You can use this for “zooming in” on something like a time series plot. Here’s the code for an app I wrote based on data from the babynames package – in this case the brush let’s you zoom to see name frequency over specific range of years.
# http://apps.bioconnector.virginia.edu/names/
library(shiny)
library(ggplot2)
library(ggthemes)
library(babynames)
library(scales)

options(scipen=999)

ui = fluidPage(titlePanel(title = "names (1880-2012)"),
textInput("name", "enter a name"),
actionButton("go", "search"),
plotOutput("plot1", brush = "plot_brush"),
plotOutput("plot2"),
htmlOutput("info")

)

server = function(input, output) {

dat = eventReactive(input$go, {

subset(babynames, tolower(name) == tolower(input$name))

})

output$plot1 = renderPlot({

ggplot(dat(), aes(year, prop, col=sex)) +
geom_line() +
xlim(1880,2012) +
theme_minimal() +
# format labels with percent function from scales package
scale_y_continuous(labels = percent) +
labs(list(title ="% of individuals born with name by year and gender",
x = "n click-and-drag over the plot to 'zoom'",
y = ""))

})

output$plot2 = renderPlot({

# need latest version of shiny to use req() function
req(input$plot_brush)
brushed = brushedPoints(dat(), input$plot_brush)

ggplot(brushed, aes(year, prop, col=sex)) +
geom_line() +
theme_minimal() +
# format labels with percent function from scales package
scale_y_continuous(labels = percent) +
labs(list(title ="% of individuals born with name by year and gender",
x = "",
y = ""))

})

output$info = renderText({

"data source: social security administration names from babynames package

"


})

}

shinyApp(ui, server)

gadgets

A relatively easy way to leverage Shiny reactivity for visual inspection and interaction with data within RStudio. The main difference here is that you’re using an abbreviated (or ‘mini’) ui. The advantage of this workflow is that you can include it in your script to make your analysis interactive. I modified the example in the documentation and wrote a basic brushing gadget that removes outliers:
library(shiny)
library(miniUI)
library(ggplot2)

outlier_rm = function(data, xvar, yvar) {

ui = miniPage(
gadgetTitleBar("Drag to select points"),
miniContentPanel(
# The brush="brush" argument means we can listen for
# brush events on the plot using input$brush.
plotOutput("plot", height = "100%", brush = "brush")
)
)

server = function(input, output, session) {

# Render the plot
output$plot = renderPlot({
# Plot the data with x/y vars indicated by the caller.
ggplot(data, aes_string(xvar, yvar)) + geom_point()
})

# Handle the Done button being pressed.
observeEvent(input$done, {

# create id for data
data$id = 1:nrow(data)

# Return the brushed points. See ?shiny::brushedPoints.
p = brushedPoints(data, input$brush)

# create vector of ids that match brushed points and data
g = which(p$id %in% data$id)

# return a subset of the original data without brushed points
stopApp(data[-g,])
})
}

runGadget(ui, server)
}

# run to open plot viewer
# click and drag to brush
# press done return a subset of the original data without brushed points
library(gapminder)
outlier_rm(gapminder, "lifeExp", "gdpPercap")

# you can also use the same method above but pass the output into a dplyr pipe syntax
# without the selection what is the mean life expectancy by country?
library(dplyr)
outlier_rm(gapminder, "lifeExp", "gdpPercap") %>%
group_by(country) %>%
summarise(mean(lifeExp))

req()

This solves the issue of requiring an input – I’m definitely going to use this so I don’t have to do the return(NULL) work around:
# no need to do do this any more
#
# inFile = input$file1
#
# if (is.null(inFile))
# return(NULL)

# use req() instead
req(input$file1)

profvis

Super helpful method for digging into the call stack of your R code to see how you might optimize it.
One or two seconds of processing can make a big difference, particularly for a Shiny app …

rstudio connect

Jeff Allen from RStudio gave a talk on deployment options for Shiny applications and mentioned this product, which is a “coming soon” platform for hosting apps alongside RMarkdown documents and plots. It’s not available as a full release yet, but there is a beta version for testing.

To leave a comment for the author, please follow the link and comment on their blog: Getting Genetics Done.

R-bloggers.com offers daily e-mail updates about R news and tutorials on topics such as: Data science, Big Data, R jobs, visualization (ggplot2, Boxplots, maps, animation), programming (RStudio, Sweave, LaTeX, SQL, Eclipse, git, hadoop, Web Scraping) statistics (regression, PCA, time series, trading) and more...

10 new R jobs from around the world (2016-04-04)

$
0
0

R-users Resumes

R-users.com features a Resume section with CVs from over 180 R users. You can submit your resume for free by registering as a “job seeker” (you may also browse the resumes through a paid subscription).

Here are the new R Jobs for 2016-04-04.

To post your R job on the next post

Just visit this link and post a new (free) R job to the R community. To get added exposure,  you may also post a featured job (this, however, does cost a bit of money).

New R jobs

Job seekers: please follow the links below to learn more and apply for your R job of interest:

Featured Jobs

More New Jobs

  1. Full-Time
    R Programmer @ NJ (USA)
    Dun & Bradstreet – Posted by SBDNB
    New Jersey
    United States
    3 Apr2016
  2. Full-Time
    Research Fellow in Spatial Epidemiology
    London School of Hygiene and Tropical Medicine – Posted by GAHI
    London
    England, United Kingdom
    2 Apr2016
  3. Freelance
    R programmer with knowledge of S4 class structure
    davidm
    Zürich
    Zürich, Switzerland
    30 Mar2016
  4. Freelance
    RShiny UI Developer (500 EUR / day)
    Boehringer Ingelheim – Posted by PMDIES
    Ingelheim am Rhein
    Rheinland-Pfalz, Germany
    29 Mar2016
  5. Full-Time
    Postdoc Positions / Senior Researchers – Environmental Sciences
    Czech University of Life Sciences Prague · Faculty of Environmental Science Czech Republic, Prague – Posted by Martin Hanel
    Prague
    Hlavní město Praha, Czech Republic
    29 Mar2016
  6. Full-Time
    Summer 2016 Internships for NORC at the University of Chicago
    NORC at the University of Chicago – Posted by Tal Galili
    Temple Terrace
    Florida, United States
    28 Mar2016
  7. Full-Time
    Senior Data Scientist
    KAR Auction Services – Posted by Hantley
    Anywhere
    25 Mar2016
  8. Full-Time
    Biostatistician and Data Manager @Geneva
    FIND – Posted by onga
    Genève
    Genève, Switzerland
    24 Mar2016
  9. Full-Time
    Analytics Manager
    Marin Software – Posted by fmarquez
    Austin
    Texas, United States
    23 Mar2016
  10. Full-Time
    Data Scientist (@Prague)
    CGI – Posted by CGI
    Prague
    Hlavní město Praha, Czech Republic
    22 Mar2016


In R-users.com you may see all the R jobs that are currently available.

r_jobs

(you may also look at previous R jobs posts).

Workshops announced for EARL 2016

$
0
0

(This article was first published on Mango Solutions » R Blog, and kindly contributed to R-bloggers)

EARL2016 will feature a day of workshops on 13th September preceding the full conference days.

These will be interactive workshops on a variety of R related topics, from introductory to advanced levels. Due to the interactive nature of the workshops, all attendees will be required to bring their own laptop. Please see the full information provided for each workshop to ascertain the stated prerequisites for attendance.

Workshops will be held in the Tower Hotel and places are limited and open to non-conference attendees

Please book your place asap.

All Day Workshops
13th September | 10:00 – 17:00


Workshop 1: Advanced Shiny Workshop

This full day workshop will cover the latest developments and best practices for the Shiny R package. We will cover some of the newest features in Shiny and then plunge deep into Shiny’s reactive programming framework. You will learn how to write nimble, performant Shiny apps by mastering reactive programming, a paradigm that is intrinsically different than the functional programming style you are used to in the rest of R. You will also practice writing Shiny modules, self-contained shiny components that can be reused across apps, and you will learn the best ways to debug and optimize your apps after you write them. The topics of this workshop will go over the head of many beginning Shiny users, so please consult the pre-requisites to see if this workshop is a good fit for you.

Click here for more info.

Workshop 2: A Crash Course in R

R is a powerful statistical language that supports a range of analytic tasks, from data manipulation to visualisation and model fitting. The aim of this workshop is to introduce the basic syntax and structures of the R language in a fast-paced environment. The workshop will be hands-on with scripts provided and exercises to reinforce the language fundamentals. Participants will leave this workshop with an understanding of the core building blocks of the R language, and with a set of scripts that support further learning.

Click here for more info.

Morning Workshops
13th September | 10:00 – 13:00


Workshop 3: Introduction to ggplot2

R has always been known for the strength of its visualisation tools. The aim of this workshop is to introduce just one of these tools, namely the powerful and incredibly popular ggplot2. This course is aimed at R users who have a basic working knowledge of the R language and would like to add a more advanced graphics package to their toolbox. It will provide a hands-on introduction to ggplot2 with lots of example code and graphics. Participants will leave this workshop with an understanding of how to recreate plots used in their daily workflow; how you can use the grammar of graphics to manipulate these graphics to publication ready quality and give you the knowledge to extend the grammar.

Click here for more info.

Workshop 4: Using R with Microsoft Office Products

Creating business reports is vital in communicating analysis results to business analysts and decision makers but it is often time consuming – sometimes unnecessarily so but R provides us with an easy way in which we can speed this process up. The primary aim of this workshop is to introduce how Microsoft Word and Excel reports can be created directly from R. Following this session, attendees should also be conversant in how possible options for reporting differ and specifically how the ReporteRs package can be used to obtain a finer grain control over the formatting of Word documents from R. This workshop is aimed at users with a basic knowledge of the R language.

Click here for more info.

Afternoon Workshops
13th September | 14:00 – 17:00


Workshop 5: Getting Started with Shiny

An easy framework for R users to develop web applications, shiny makes it even easier for R users to share the results of their analysis with key stakeholders not familiar with R. In this half day workshop we will introduce those new to Shiny to the key ideas that will help them to build simple web applications. The workshop will emphasise what makes an application suitable for production deployment, ensuring these best practices are adopted from the start. Whilst knowledge of R is expected this workshop is aimed at those with no prior knowledge of shiny. This will be a hands-on workshop with attendees expected to take part in a series of exercises throughout.

Click here for more info.

Workshop 6: Package Development in R

The Package Development in R workshop is aimed at R programmers who are looking to add rigour to their development by building R packages in a controlled, scalable and commercially viable manner. Attendees will learn the state of the art for designing, building and maintaining R packages. The workshop will maintain a practical and current focus using popular R packages such as devtools, roxygen2 and testthat.

Click here for more info.

Places are limited and you these workshops are open to non-conference attendees.

Book your place here


To leave a comment for the author, please follow the link and comment on their blog: Mango Solutions » R Blog.

R-bloggers.com offers daily e-mail updates about R news and tutorials on topics such as: Data science, Big Data, R jobs, visualization (ggplot2, Boxplots, maps, animation), programming (RStudio, Sweave, LaTeX, SQL, Eclipse, git, hadoop, Web Scraping) statistics (regression, PCA, time series, trading) and more...

AirbnB uses R to scale data science

$
0
0

(This article was first published on Revolutions, and kindly contributed to R-bloggers)

Airbnb, Airbnb-logothe property-rental marketplace that helps you find a place to stay when you're travelling, uses R to scale data science. Airbnb is a famously data-driven company, and has recently gone through a period of rapid growth. To accommodate the influx of data scientists (80% of whom are proficient in R, and 64% use R as their primary data analysis language), Airbnb organizes monthly week-long data bootcamps for new hires and current team members.

But just as important as the training program is the engineering process Airbnb uses to scale data science with R. Rather than just have data scientists write R functions independently (which not only is a likely duplication of work, but inhibits transparency and slows down productivity), Airbnb has invested in building an internal R package called Rbnb that implements collaborative solutions to common problems, standardizes visual presentations, and avoids reinventing the wheel. (Incidentally, the development and use of internal R packages is a common pattern I've seen at many companies with large data science teams.)

The Rbnb package used at Airbnb includes more than 60 functions and is still growing under the guidance of several active developers. It's actively used by Airbnb's engineering, data science, analytics and user experience teams, to do things like move aggregated or filtered data from a Hadoop or SQL environment into R, impute missing values, compute year-over-year trends, and perform common data aggregations. It has been used to create more than 500 research reports and to solve problems like automating the detection of host preferences and using guest ratings to predict rebooking rates.

Airbnb-code

The package is also widely used to visualize data using a standard Airbnb "look". The package includes custom themes, scales, and geoms for ggplot2; CSS templates for htmlwidgets and Shiny; and custom R Markdown templates for different types of reports. You can see several examples in the blog post by Ricardo Bion linked below, including this gorgeous visualization of the 500,000 top Airbnb trips.

Airbnb

Medium (AirbnbEng): Using R packages and education to scale Data Science at Airbnb

To leave a comment for the author, please follow the link and comment on their blog: Revolutions.

R-bloggers.com offers daily e-mail updates about R news and tutorials on topics such as: Data science, Big Data, R jobs, visualization (ggplot2, Boxplots, maps, animation), programming (RStudio, Sweave, LaTeX, SQL, Eclipse, git, hadoop, Web Scraping) statistics (regression, PCA, time series, trading) and more...

Plotting App for ggplot2

$
0
0

(This article was first published on DataScience+, and kindly contributed to R-bloggers)

Through this post, I would like to share an update to my RTutoR package. The first version of this package included an R Basics Tutorial App which I published earlier at DataScience+

The updated version of this package, which is now on CRAN, includes a plotting app. This app provides an automated interface for generating plots using the ggplot2 package. Current version of the app supports 10 different plot types along with options to manipulate specific aesthetics and controls related to each plot type. The app also displays the underlying code which generates the plot and this feature would hopefully be useful for people trying to learn ggplot2. The app also utilizes the plotly package for generating interactive plots which is especially suited for performing exploratory analysis.

A video demo on how to use the app is provided at the end of the post. The app is also hosted Shinyapps.io. However, unlike the package version, you would not be able to use your own dataset. Instead, the app provides a small set of pre-defined datasets to choose from.

High level overview of ggplot2

For people who are completely new to gglot2, or have just started working on it, I provide below a quick, concise overview of the ggplot2 package. This is not meant to be comprehensive, but just covers some key aspects so that it’s easier to understand how the app is structured and to make the most of it. You also can read a published tutorial in DataScience+ for ggplot2.

The template for generating a basic plot using ggplot2 is as follows:

ggplot(data_set) + plot_type(aes(x_variable,y_variable)) #For univariate analysis, you can specify just one variable

plot_type specifies the type of plot that should be constructed. There are more than 35 different plot types in ggplot2. (The current version of the app, however, supports only 10 different plot types)

ggplot2 provides an extensive set of options to manipulate different aesthetics of a plot. Aesthetics can be manipulated in one of two ways:

  • Manually setting the aesthetic
  • Mapping the aesthetic to a variable

To manually set the aesthetic, include the code outside the aes call. For example, the code below generates a scatter plot and colors the point red, using the color aesthetic

ggplot(iris) + geom_point(aes(Sepal.Length,Sepal.Width), color = "red")

To map the aesthetic to a variable, include the code inside the aes call. For example to color the scatter plot as per the Species type we will the modify the code above as follows:

ggplot(iris) + geom_point(aes(Sepal.Length,Sepal.Width,color = Species))

Not all aesthetics are applicable to all plot types. For e.g. the linetype aesthetic (which controls the line format), is not applicable to geom_point for instance (The app only displays those aesthetics which are applicable to the selected plot type)

A plot may also include controls specific to that plot type. Smoothing curve(geom_smooth), for example, provides a “method” argument to control the smoothing function that is used for fitting the curve. ggplot2 provides an extensive set of options for different plot types (A good reference to read about the various options is ggplot2’s documentation here) The app does not include all the various options that are available, but tries to incorporate few of the most commonly used ones.

Multiple layers can be added to a plot. For example, the code below plots a scatter plot and fits a smoothing line as well:

ggplot(mtcars,aes(mpg,hp)) + geom_point() + geom_smooth()

Note: The way the app is coded, we need to specify the aesthetics for each plot separately, even if the aesthetics are same for each plot. Hence, if we construct this plot using the app, the underlying code that is displayed,would read:

ggplot(mtcars) + geom_point(aes(mpg,hp)) + geom_smooth(aes(mpg,hp))

Related Post

  1. Performing SQL selects on R data frames
  2. Developing an R Tutorial shiny dashboard app
  3. Strategies to Speedup R Code
  4. Sentiment analysis with machine learning in R
  5. Sentiment Analysis on Donald Trump using R and Tableau


To leave a comment for the author, please follow the link and comment on their blog: DataScience+.

R-bloggers.com offers daily e-mail updates about R news and tutorials on topics such as: Data science, Big Data, R jobs, visualization (ggplot2, Boxplots, maps, animation), programming (RStudio, Sweave, LaTeX, SQL, Eclipse, git, hadoop, Web Scraping) statistics (regression, PCA, time series, trading) and more...

Shiny module design patterns: Pass a single input to multiple modules

$
0
0

(This article was first published on R – It's a Locke, and kindly contributed to R-bloggers)

For the awesome Shiny Developers Conference back in January, I endeavoured to learn about shiny modules and overhaul an application using them in the space of two days. I succeeded and almost immediately switched onto other projects, thereby losing most of the hard-won knowledge! As I rediscover shiny modules and start putting them into more active use, I’ll be blogging about design patterns. This post takes you through the case of multiple modules receiving the same input value.

TL;DR

Stick overall config input objects at the app level and pass them in a reactive expression to callModule(). Pass the results in as an extra argument into subsequent modules. These are reactive so don’t forget the brackets. Steal the code and, as always, if you can improve it do so!

Starting out

For the purposes of this post, I’ll be morphing the dummy application that Rstudio produces when you use New file > Shiny app. I’ve created a repository to store these design patterns in and the default shiny app that will be converted / mangled is the 01_original.R file.

input value being directly used in shiny app

Pass a single input to multiple modules

Make a reactive value

The first thing you might assume you can do when you want to pass an input value to a module is simply do callModule(chart,"chartA",input$bins). Unfortunately, this does not work because the callModule() function is not inherently reactive. it has to be forced to be reactive with a reactive value.

We can make a reactive value very simply:

bins<-reactive({ input$bins })

Make a module that accepts additional arguments

The vanilla module server function construct is function(input,output,session){}. There isn’t room for extra parameters to be passed through so we have to make space for one. In this case, our module skeleton that will hold our histogram code is

charts <- function( input, output, session, bins) {

}

To pass through our reactive value then becomes

bins<-reactive({ input$bins })
callModules(charts, "chartA", bins)

Use the reactive value

When you reference a reactive value, you reference it like a function. We need to use bins() instead so that the result of the reactive value is returned.

Instead of bins <- seq(min(x), max(x), length.out = input$bins + 1) in our original, when we use our reactive value in our chart module, it becomes:

chart <- function(input, output, session, bins) {
  output$distPlot <- renderPlot({
    x    <- faithful[, 2]
    bins <- seq(min(x), max(x), length.out = bins() + 1)
    hist(x,
         breaks = bins,
         col = 'darkgray',
         border = 'white')
  })
}

Putting it together

To be able to pass an input value to a module, you need to:

  1. Make a reactive variable holding the input value
  2. Add an argument to your module’s server function arguments
  3. Pass the name of the reactive variable to the module
  4. Use argument() not argument within the module’s server function main code

See file 02_singlegloballevelinput.R for the end to end solution.

Store input in a reactive value to pass value onto modules

Further study

The post Shiny module design patterns: Pass a single input to multiple modules appeared first on It's a Locke.

To leave a comment for the author, please follow the link and comment on their blog: R – It's a Locke.

R-bloggers.com offers daily e-mail updates about R news and tutorials on topics such as: Data science, Big Data, R jobs, visualization (ggplot2, Boxplots, maps, animation), programming (RStudio, Sweave, LaTeX, SQL, Eclipse, git, hadoop, Web Scraping) statistics (regression, PCA, time series, trading) and more...

Election analysis contest entry part 3 – interactive exploration of voting locations with leaflet and Shiny

$
0
0

(This article was first published on Peter's stats stuff - R, and kindly contributed to R-bloggers)

Motivation

This post is the third in a series that make up my entry in Ari Lamstein’s R Election Analysis Contest.

First I introduced the nzelect R package from a user perspective. Second was a piece on how the build of that package works. Today, the third in the series introduces an interactive map of results by voting location drawing on the data in nzelect, built with Shiny.

Overview

The point of the tool is to facilitate comparison of support for parties by fine grained location, well below the electorate level that is usually used as the area of analysis. I’ve included data for the party vote of the eight most successful parties in the 2014 election. Party vote determines the ultimate make up of Parliament (see this previous post for a brief discussion of how the New Zealand system works) and is more comparable across locations than is candidate vote for a number of reasons.

Here’s the Shiny app in action:

Most users will prefer the full screen version.

What you can do with this app includes:

  • you can use the drop down box to add circles representing the percentage of vote at any voting place for each of up to 8 parties. Each time you select a new party, it adds new circles on the front of the graphic – so if you want to compare two parties it’s a good idea to choose the more popular (for your shown location) first, and overlay the less popular one on top of it
  • you can move the map around to a part of New Zealand you’re interested in and zoom in or out, and the markers will resize to be visible
  • you can click on the individual circles to get a tooltip showing the actual number of votes for that party in that location (only really readable in the full screen version).
  • you can rescale the circles – recommended if you’re looking at parties other than Labour, National and Green.

It’s definitely most interesting when you’re comparing two parties. Remember that these data show the locations where people voted (on a Saturday), which is presumed to be generally but not always close to but not identical to where they live and / or (less often) work. Here’s some snapshots of interesting contrasts:

New Zealand First compared to Maori Party in the Northland area

northland

New Zealand First outperformed the Maori Party comprehensively in Northland, showing there’s no inevitable link from higher proportions of Maori ethnicity to supporting the party of that name. More exploring shows the Maori Party’s strongest support in parts of Bay of Plenty, Taupo and Gisborne (upper right north island, for non-New Zealanders, and like Northland, concentrations of people with Maori ethnicity).

National compared to Labour in Auckland

auckland

The fine grained pattern of National Party (blue circle) support compared to the Labour Party in Auckland’s inner suburbs is extremely marked:

  • Near parity in the city centre;
  • National dominance in the eastern and (to a lesser extent) northern inner suburbs;
  • Labour stronger around Tamaki (to the right of the image) plus some pockets in the south-west.

When analysed at an electorate level, that Labour support in the bottom right of the image in Tamaki the suburb is missed because it is wrapped up in the overall strongly-National Tamaki electorate, Robert Muldoon’s old electorate and returning National MPs uninterruptedly since the 1960s.

Greens compared to Labour in Wellington

wellington

The two main parties of the left in New Zealand are Labour and the Greens. Green Party support relative to Labour Party in the Wellington area is a very regional phenomenon. Green party votes in 2014 were focused in the inner city and suburbs with small patches in other suburbs that perhaps are unsurprising to political tacticians who know Wellington’s spatial socio-demographics. This follows the trend (in New Zealand and similar countries) for the educated, well off, younger left to more generally support the Greens than the older parties of the left. Note the traditional working class Labour Party strongholds in Lower Hutt and Wainuiomata areas.

A trick with leaflet and Shiny

The web app is put together with shiny and leaflet. This next snippet of blog assumes the reader knows the basics of Shiny and is interested in specifics related to this app.

The source code of the Shiny app is at https://github.com/ellisp/nzelect/tree/master/examples/leaflet. There’s some prep done to create the necessary data files elsewhere in the repository at https://github.com/ellisp/nzelect/blob/master/prep/shiny_prep.R.

Updating an existing map

I won’t go through it line by line but will point out one interesting feature now available with leaflet and R. The leafletProxy() function in the leaflet package, in combination with observe() from shiny, let’s you delete or redraw elements of an existing leaflet map that the user has zoomed in or out on and changed its location, without redrawing the whole map. This is essential for a decent user experience and wasn’t in the early releases of the leaflet R package.

In case someone else is interested in it here is an excerpt from the shiny.R file of my Shiny app showing how the existing map MyMap gets circles added to it when the reactive object the_data() changes as a result of the user picking a new political party to show. In this case, a new set of circles is added with addCircleMarkers(), superimposed over whatever is currently on the map.

observe({
     leafletProxy("MyMap", data = the_data()$df) %>%
            addCircleMarkers(~WGS84Longitude, 
                             ~WGS84Latitude,
                             color = the_data()$thecol,
                             radius = ~prop * 30 * input$sc,
                             popup = ~lab) 
    })

Similarly, here’s the trick I use to clear all the circle markers when the user presses the button labelled “Clear all parties”. That button increases the value of input$clear1 by one, and by referring to it inside an observer with the otherwise pointless x <- input$clear1 (see below) I activate that observer, which then updates the selected party to be blank, and clears all the markers off MyMap.

observe({
        x <- input$clear1
        updateSelectInput(session, "party", selected = "")
        leafletProxy("MyMap") %>% clearMarkers()
    })

That watercolour background…

The beautiful (I think) water colour background, with just enough labels on it to let you know where you are but not clutter it up like the usual roadmap, comes from overlaying Stamen Watercolor and TonerLabels layers.


That’s all for today. Happy exploring the fine grained details of New Zealand voting locations. If you spot a bug or other issue with the map please file an issue with the nzelect project. If you just want to comment on this post or anything related, use comments section below.

To leave a comment for the author, please follow the link and comment on their blog: Peter's stats stuff - R.

R-bloggers.com offers daily e-mail updates about R news and tutorials on topics such as: Data science, Big Data, R jobs, visualization (ggplot2, Boxplots, maps, animation), programming (RStudio, Sweave, LaTeX, SQL, Eclipse, git, hadoop, Web Scraping) statistics (regression, PCA, time series, trading) and more...

In case you missed it: March 2016 roundup

$
0
0

(This article was first published on Revolutions, and kindly contributed to R-bloggers)

In case you missed them, here are some articles from February of particular interest to R users. 

Reviews of new CRAN packages RtutoR, lavaan.shiny, dCovTS, glmmsr, GLMMRR, MultivariateRandomForest, genie, kmlShape, deepboost and rEDM.

You can now create and host Jupyter notebooks based on R, for free, in Azure ML Studio.

Calculating learning curves for predictive models with doParallel.

An amusing look at some of R's quirks, by Oliver Keyes.

A recording of a recent talk I gave on real-time predictive analytics, featuring R.

A preview of the New York R Conference.

The R Consortium has funded seven community projects and two working groups for R projects.

A look at several methods for computing and assessing the performance of classification models, with R.

An application to help airlines prevent unexpected maintenance delays, based on predictive models created with R.

Using R to predict the winning basketball team in the March Madness competition.

How to call an R function from an Excel worksheet after it's been published as a service to Azure ML.

You can now use magrittr pipes with the out-of-memory XDF data files used by Microsoft R Server.

Watch the recorded webinar "Data Preparation Techniques with R", and download the free e-book by Nina Zumel.

An R-based application to automatically classify galaxies in the World Wide Telescope was featured in a keynote at Microsoft's Data Driven event.

Microsoft R Server is now available in the Azure Marketplace.

R 3.2.4 was released by the R Core Group on March 10.

Previews of some talks at the Bay Area R Users Group.

R Tools for Visual Studio, which lets you edit and debug R code within Visual Studio, is now available.

A tutorial on creating election maps with R, from ComputerWorld.

A history of the R project since the release of version 1.0.0.

Calculating confidence intervals for Random Forest predictions based on a corrected jackknife estimator.

Microsoft's Data Science Virtual Machine now includes Microsoft R Server.

Using a pet tracker and R to map the movements of a cat.

General interest stories (not related to R) in the past month included: typography in movies, solving a rubiks cube while juggling it, pianograms and a robot rebellion.

As always, thanks for the comments and please send any suggestions to me at davidsmi@microsoft.com. Don't forget you can follow the blog using an RSS reader, via email using blogtrottr, or by following me on Twitter (I'm @revodavid). You can find roundups of previous months here.

To leave a comment for the author, please follow the link and comment on their blog: Revolutions.

R-bloggers.com offers daily e-mail updates about R news and tutorials on topics such as: Data science, Big Data, R jobs, visualization (ggplot2, Boxplots, maps, animation), programming (RStudio, Sweave, LaTeX, SQL, Eclipse, git, hadoop, Web Scraping) statistics (regression, PCA, time series, trading) and more...

Try’in to 3D network: Quest (shiny + plotly)

$
0
0

(This article was first published on r-bloggers – Creative Data Solutions, and kindly contributed to R-bloggers)


I have an unnatural obsession with 4-dimensional networks. It might have started with a dream, but VR  might make it a reality one day. For now I will settle for  3D networks in Plotly.

pp

Presentation: R users group (more)


More: networkly

To leave a comment for the author, please follow the link and comment on their blog: r-bloggers – Creative Data Solutions.

R-bloggers.com offers daily e-mail updates about R news and tutorials on topics such as: Data science, Big Data, R jobs, visualization (ggplot2, Boxplots, maps, animation), programming (RStudio, Sweave, LaTeX, SQL, Eclipse, git, hadoop, Web Scraping) statistics (regression, PCA, time series, trading) and more...

Desktop DeployR

$
0
0

(This article was first published on Odd Hypothesis, and kindly contributed to R-bloggers)

I'm going to be giving a talk this Thursday at my local R/Data Science Meetupabout my method for deploying self contained desktop R applications. Since my original post on the subject (over 2 years ago!) I've made manyof improvements thanks to the many useful comments I received and my own "dog-fooding".

So many in fact that the framework is a project in its own right, which I'm calling DesktopDeployR. This post will officially document the changes I've made and share the project to the greater R/Data Science community.

If you haven't already, I recommend reading my original post to understand the fundamentals of how such deployments are done.

For the impatient, the TL;DR summary is: on a Windows system, use R-Portable and Windows Scripting Host to launch a Shiny app in a user's default web browser.

Changes

  • System and R scripts for app launch are more separated from app specific code. Specifically, the framework's directory structure is now:

    <app>/
     +- app/
     |  +- library/ # <- private app library
     |  +- shiny/   # <- where shiny app files go
     |  +- app.R
     |  +- config.cfg
     |  +- packages.txt
     +- dist/       # <- the core framework
     |  +- R-Portable/
     |  +- script/
     +- log/
     +- appname.bat

    This means you can drop a pre-made Shiny application alongside the launch framework and it should work with minimal effort.

    Being app-agnostic also means that the the framework is not specific to Shiny apps. I have successfully tested it with RGtk and Tcl/Tk based apps as well. It is just a matter of putting the necessary code to start your app in app.R. For a Shiny app, this is simply the following line:

    shiny::runApp('./app/shiny')
  • App launch is configurable via a JSON config file (shown above in the app/folder). There are options to configure:

    • the path to an R installation, so that a system one can be specified instead of R-Portable, making the deployed app size smaller (if that's important to you).
    • the CRAN mirror to use for installing package dependencies
    • where error logs are stored – e.g. with the app in the log/ folder or in a user's home directory on the system.
  • Windows Scripting Host scripts are now written in Javascript, because it was a mistake to use VBScript, especially with regards to parsing JSON config files.

  • Primary app package dependencies are specified in a packages.txt file which is used to create a private package library when the app is first launched. This was inspired by requirements.txt files used to install a set of Python packages using pip.

    The private library is added to .libPaths() at launch, so modifying an Rprofile.site file is no longer necessary.

  • Primary app package dependencies are also "ensured", meaning if they change (i.e. new ones are added) they are installed into the private library the next time the app is launched.

  • There is a GUI progress bar displayed during launch that updates as primary package dependencies are loaded. This is useful feedback that the app is actually something, especially if there a many dependencies to load.

  • As before, you still need to download the version of R-Portableyou need and install it into a template framework that you clone for each deployment. However, Since the app uses a private library for dependencies, the R-Portable install can stay and be launched "vanilla", which makes swapping it out (e.g. for upgrades) much easier.

  • Chrome Portable is no longer part of the framework. It behaved very inconsistently and would generate errors that I hadn't a clue how to debug. The current crop of browsers (IE10+ included) all work well with Shiny. This is also a moot point if you're deploying a non-Shiny app.

Availability

Now that the framework is more portable, I can also more easily open source it. If you want to give it a try with your own projects the GitHub repository is here. I'd also appreciate any feedback (or help) to make it better.

Happy DesktopDeployR-ing!

To leave a comment for the author, please follow the link and comment on their blog: Odd Hypothesis.

R-bloggers.com offers daily e-mail updates about R news and tutorials on topics such as: Data science, Big Data, R jobs, visualization (ggplot2, Boxplots, maps, animation), programming (RStudio, Sweave, LaTeX, SQL, Eclipse, git, hadoop, Web Scraping) statistics (regression, PCA, time series, trading) and more...

52 Vis Week #2 Wrap Up

$
0
0

(This article was first published on R – rud.is, and kindly contributed to R-bloggers)

I’ve been staring at this homeless data set for a few weeks now since I’m using it both here and in the data science class I’m teaching. It’s been one of the most mindful data sets I’ve worked with in a while. Even when reduced to pure numbers in named columns, the names really stick with you…“Unsheltered Homeless People in Families”“Unsheltered Chronically Homeless”“Homeless Veterans”“Unsheltered Homeless Unaccompanied Youth”. These are real people, really hurting.

That’s one of the superpowers “Data Science” gives you: the ability to shed light on the things that matter and to tell meaningful stories that people need to hear. From my interactions with some of the folks who submitted entries, I know they, too, were impacted by the stories contained in this data set. Let’s see what they uncovered.

(All the code & un-shrunk visualizations are in the 52vis github repo)

Camille compared a point-in-time view of one of the most vulnerable parts of the population—youth (under 25)—with the overall population:

homeless_rates

The youth homelessness situation in Nevada seems especially disconcerting and I wonder how much better/worse it might be if we factored in the 25 & under U.S. census information (I’m really a bit reticent to run those numbers for fear it’ll be even worse).

Craine Munton submitted our first D3 entry! I ended up tweaking some of the JS & CSS hrefs (to fix non-sync’d files) and you can see the full version here. I’m going to try to embed it below as well (I’ll leave it up even if it’s not fully sized well. Just hit the aforementioned URL for the full-browser version).

Craine focused on another vulnerable and sometimes forgotten segment: those that put their lives on the line for our freedom and the safety and security of threatened people groups around the globe.

Joshua Kunst is an incredibly talented individual who has made a number of stunning visualizations in R. He used htmlwidgets to tell a captivating story that ends in (statistically inferred) hope.

Hit the full page for the frame-busted visualization.

Jake Kaupp took inspiration from Alberto Cairo and created some truly novel visualizations. I’m putting the easiest to embed first:

Jake has written a superb piece on his creation, included an interactive Shiny app and brought in extra data to try to come to grips with this data. Definitely take time to read his post (even if it means you never get back to this post).

His small-multiples view is below but you should click on it to see it in full-browser view.

Jonathan Carroll (another fellow rOpenSci’er) created a companion blog post for his animated choropleth entry:

HomelessPopulation_optim

I really like how it highlights the differences per year and a number of statistical/computational choices he made.

Julia Silge focused on youth as well asking two compelling questions (you can read her exposition as well):

unnamed-chunk-7-1

unnamed-chunk-9-1

(In seeing this second youth-focused vis and also having a clearer picture of the areas of greatest concern, I’m wondering if there’s a climate/weather-oriented reason for certain areas standing out when it comes to homeless youth issues.)

Philipp Ottolinger took a statistical look at youth and veterans:

homeless_plot

Make sure to dedicate some cycles to check out his approach.

@patternproject did not succumb to the temptation to draw a map just because “it’s U.S. State data” and chose, instead, to look across time and geography to tease out patterns using a heatmap.

Rplot01

I really like this novel approach and am now rethinking my approach geo-temporal visualizations.

Xan Gregg looked at sheltered vs unsheltered homeless populations from a few different viewpoints (including animation).

homelesslines

homelessmaps

sheltered-homeless-by-state

(Again, beautiful work in JMP).

We have a winner

The diversity and craftsmanship of these entries was amazing to see, as was the care and attention each submitter took when dealing with this truly tough subject. I was personally impacted by each one and I hope it raised awareness in the broader data science community.

I couldn’t choose between Joshua Kunst’s & Jake Kaupp’s entries so they’re tied for first place and they’ll both be getting a copy of Data-Driven Security.

Joshua & Jake: hit up bob at rudis dot net to claim your prize!

A $50.00 donation has also been made to the National Coalition for the Homeless dedicating it by name to each of the contest participants.

To leave a comment for the author, please follow the link and comment on their blog: R – rud.is.

R-bloggers.com offers daily e-mail updates about R news and tutorials on topics such as: Data science, Big Data, R jobs, visualization (ggplot2, Boxplots, maps, animation), programming (RStudio, Sweave, LaTeX, SQL, Eclipse, git, hadoop, Web Scraping) statistics (regression, PCA, time series, trading) and more...
Viewing all 673 articles
Browse latest View live