Quantcast
Channel: Search Results for “shiny”– R-bloggers
Viewing all 673 articles
Browse latest View live

The R-Podcast Episode 14: Tips and Tricks for using R-Markdown

$
0
0

(This article was first published on The R-Podcast, and kindly contributed to R-bloggers)

The R-Podcast is back up and running! In this episode I discuss some useful resources and helpful tips/extensions that have greatly enhanced my work flow in creating reproducible analysis documents via R-Markdown. I also highlight some exciting new endeavors in the R community as well as provide my take on two key events that further illustrate the rapidly growing use of R across many industries. A big thank you to all who expressed their support during the extended hiatus, and please don’t hesitate to provide your feedback and suggestions for future episodes. I hope you enjoy this episode!

Episode 14 Show Notes

Resources produced by RStudio:

  • R-Markdown home site: http://rmarkdown.rstudio.com/ (check out the articles section)
  • Webinar on getting started with R Markdown: https://www.rstudio.com/resources/webinars/archives/
  • Webinar Escape the Land of LaTeX/Word for Statistical Reporting: The Ecosystem of R Markdown https://www.rstudio.com/resources/webinars/
  • R-Markdown cheat sheet
  • R-Markdown Reference Guide

Viewing R-Markdown output in real-time

  • Use Yihui’s servr package to provide real-time viewing of document in RStudio viewer while editing the source file.

Creating tables in R-markdown:

  • Pander package offers many customized table options for markdown
  • kable function in the knitr package

Dealing with multiple output formats:

Insert following code chunk in beginning of document

```{r, echo = FALSE}
out_type <- knitr::opts_knit$get("rmarkdown.pandoc.to")
```

Then use conditional logic to perform different tasks depending on output type (docx, html, pdf, md)

Interactivity with R Markdown:

R Community Roundup

  • The R-Talk Podcast: Check out their interviews with David Smith and Jenny Bryan
  • Not So Standard Deviations Podcast: While not specifically focused on R, it has come up quite a bit in their early episodes, such as their talk of the impact of the "Hadleyverse"
  • METACRAN: METACRAN is a (somewhat integrated) collection of small services around the CRAN repository of R packages. It contains this website, a mirror at GitHub, a database with API, package search, database of package downloads (from the RStudio mirror), tools to check R packages on GitHub, etc.
  • Hadley Wickham's recent Redditt AMA!
  • First-ever Shiny Developer Conference to be held at Stanford University on January 30-21, 2016 (agenda)

Package Pick

  • captioner: An R package for generating figure/table numbers and captions, especially for Rmd docs
  • Using captioner vignette

News

Linux Foundation Announces R Consortium to Support Millions of Users Around the World

  • "The R language is used by statisticians, analysts and data scientists to unlock value from data. It is a free and open source programming language for statistical computing and provides an interactive environment for data analysis, modeling and visualization. The R Consortium will complement the work of the R Foundation, a nonprofit organization based in Austria that maintains the language. The R Consortium will focus on user outreach and other projects designed to assist the R user and developer communities."

  • "Founding companies and organizations of the R Consortium include The R Foundation, Platinum members Microsoft and RStudio; Gold member TIBCO Software Inc.; and Silver members Alteryx, Google, HP, Mango Solutions, Ketchum Trading and Oracle."

  • Hadley Wickham elected as chair of the Infrastructure Steering Committee (ISC)

  • "The R Consortium’s first grant is awarded to Gábor Csárdi, Ph.D., to implement R-Hub, a new service for developing, building, testing and validating R packages. R-Hub will be complementary to both CRAN, the major repository for open source R packages, and R-Forge, the platform supporting R package developers. R-Hub will provide build services, continuous integration for R packages and a distribution mechanism for R package sources and binaries."

Microsoft Closes Acquisition of Revolution Analytics

  • "R is the world’s most popular programming language for statistical computing and predictive analytics, used by more than 2 million people worldwide. Revolution has made R enterprise-ready with speed and scalability for the largest data warehouses and Hadoop systems. For example, by leveraging Intel’s Math Kernel Library (MKL), the freely available Revolution R Open executes a typical R benchmark 2.5 times faster than the standard R distribution and some functions, such as linear regression, run up to 20 times faster. With its unique parallel external memory algorithms, Revolution R Enterprise is able to deliver speeds 42 times faster than competing technology from SAS."

  • "We’re excited the work we’ve done with Revolution R will come to a wider audience through Microsoft. Our combined teams will be able to help more users use advanced analytics within Microsoft data platform solutions, both on-premises and in the cloud with Microsoft Azure. And just as importantly, the big-company resources of Microsoft will allow us to invest even more in the R Project and the Revolution R products. We will continue to sponsor local R user groups and R events, and expand our support for community initiatives. We’ll also have more resources behind our open-source R projects including RHadoop, DeployR and the Reproducible R Toolkit. And of course, we’ll be able to add further enhancements to Revolution R and bring R capabilities to the Microsoft suite of products."

To leave a comment for the author, please follow the link and comment on their blog: The R-Podcast.

R-bloggers.com offers daily e-mail updates about R news and tutorials on topics such as: Data science, Big Data, R jobs, visualization (ggplot2, Boxplots, maps, animation), programming (RStudio, Sweave, LaTeX, SQL, Eclipse, git, hadoop, Web Scraping) statistics (regression, PCA, time series, trading) and more...

Making an R based ML model accessible through a simple API

$
0
0

(This article was first published on FishyOperations, and kindly contributed to R-bloggers)

Building an accurate machine learning (ML) model is a feat on its own. But once you’re there, you still need to find a way to make the model accessible to users. If you want to create a GUI for it, the obvious approach is going after shiny. However, often you don’t want a direct GUI for a ML model but you want to integrate the logic you’ve created into an existing (or new) application things become a bit more difficult.

Let’s say you’ve created a robust ML model in R and explain the model to your in-house IT department, it is (currently) definitely not a given that they can easily integrate it. Be it either due to the technology used is unfamiliar to them or because they simply don’t have a in-depth knowledge on ML.

There are a lot of way to go about this. One way (and the focus of this post) is to built a sort of “black-box” model which is accessible through a web-based API. The advantage of this is that a web call can be very easily made from (almost) any programming language, making integration of the ML model quite easy.

Below an example ML model is made accessible by using Jug (disclaimer: I’m the author of Jug :).

Training the model

We start by creating a very simple model based on the mtcars dataset and the randomForest package (don’t interpret this as the way to correctly train a model). This model is then saved to the file system.

The model tries to predict mpg based on the disp, wt and hp variables.

The summary of the resulting model:


Call:
 randomForest(formula = mpg ~ disp + wt + hp, data = mtcars) 
               Type of random forest: regression
                     Number of trees: 500
No. of variables tried at each split: 1

          Mean of squared residuals: 5.421786
                    % Var explained: 84.59

Setting up the API

For setting up the API we use Jug.

Serving the jug at http://127.0.0.1:8080

So, what does this code do? The mpg_fit holds the fitted ML model. The predict_mpg function uses this model and returns a predicted value based on the received disp, wt and hp parameters.

The part starting with jug() %>% configures and launches the API. If it receives a post request at the /mpg_api path (with the requested parameters) it returns the result of decorate(predict_mpg) to the post call.

The decorate function is basically a convenience function which maps the supplied parameters (form-data, url-encoded, …) to the function you supply it. The error handler is simply there to avoid the server crashing when it gets called with an unbound path/erroneous data.

The serve_it() call launches the API instance.

Calling the API

The result is that we now have a live web-based API. We can post data to it and get back a predicted value. Below an example post call using curl.

curl -s --data "disp=160&wt=2620&hp=110" http://127.0.0.1:8080/mpg_api

>> 18.9758366666667

This R app can then be launched on a server which in turn can receive post calls from any type of application which can make web calls.

Other packages

Also have a look at the base httpuv package (which is the basis for Jug) and the more applied prairie (previously known as dull) and plumber packages.

To leave a comment for the author, please follow the link and comment on their blog: FishyOperations.

R-bloggers.com offers daily e-mail updates about R news and tutorials on topics such as: Data science, Big Data, R jobs, visualization (ggplot2, Boxplots, maps, animation), programming (RStudio, Sweave, LaTeX, SQL, Eclipse, git, hadoop, Web Scraping) statistics (regression, PCA, time series, trading) and more...

Sixer – R package cricketr’s new Shiny avatar

$
0
0

(This article was first published on Giga thoughts ... » R, and kindly contributed to R-bloggers)

In this post I create a Shiny App, Sixer, based on my R package cricketr. I had developed the R package cricketr, a few months back for analyzing the performances of batsman and bowlers in all formats of the game (Test, ODI and Twenty 20). This package uses the statistics info available in ESPN Cricinfo Statsguru. I had written a series of posts using the cricketr package where I chose a few batsmen, bowlers and compared their performances of these players. Here I have created a complete Shiny app with a lot more players and with almost all the features of the cricketr package. The motivation for creating the Shiny app was to

  • To show case the  ‘cricketr’ package and to highlight its functionalities
  • Perform analysis of more batsman and bowlers
  • Allow users to interact with the package and to allow them to try out the different features and functions of the package and to also check performances of some of their favorite crickets

a) You can try out the interactive  Shiny app Sixer at – Sixer
b) The code for this Shiny app project can be cloned/forked from GitHub – Sixer
Note: Please be mindful of  ESPN Cricinfo Terms of Use.

In this Shiny app I have 4 tabs which perform the following function
1.  Analyze Batsman
This tab analyzes batsmen based on different functions and plots the performances of the selected batsman. There are functions that compute and display batsman’s run-frequency ranges, Mean Strike rate, No of 4’s, dismissals, 3-D plot of Runs scored vs Balls Faced and Minutes at crease, Contribution to wins & losses, Home-Away record etc. The analyses can be done for Test cricketers, ODI and Twenty 20 batsman. I have included most of the Test batting giants including Tendulkar, Dravid, Sir Don Bradman, Viv Richards, Lara, Ponting etc. Similarly the ODI list includes Sehwag, Devilliers, Afridi, Maxwell etc. The Twenty20 list includes the Top 10 Twenty20 batsman based on their ICC rankings

2. Analyze bowler
This tab analyzes the bowling performances of bowlers, Wickets percentages, Mean Economy Rate, Wickets at different venues, Moving average of wickets etc. As earlier I have all the Top bowlers including Warne, Muralidharan, Kumble- the famed Indian spin quartet of Bedi, Chandrasekhar, Prasanna, Venkatraghavan, the deadly West Indies trio of Marshal, Roberts and Holding and the lethal combination of Imran Khan, Wasim Akram and Waqar Younis besides the dangerous Dennis Lillee and Jeff Thomson. Do give the functions a try and see for yourself the performances of these individual bowlers

3. Relative performances of batsman
This tab allows the selection of multiple batsmen (Test, ODI and Twenty 20) for comparisons. There are 2 main functions Relative Runs Frequency performance and Relative Mean Strike Rate

4. Relative performances of bowlers
Here we can compare bowling performances of multiple bowlers, which include functions Relative Bowling Performance and Relative Economy Rate. This can be done for Test, ODI and Twenty20 formats
Some of my earlier posts based on the R package cricketr include
1. Introducing cricketr!: An R package for analyzing performances of cricketers
2. Taking cricketr for a spin – Part 1
3. cricketr plays the ODIs
4. cricketr adapts to the Twenty20 International
5. cricketr digs the Ashes

Do try out the interactive Sixer Shiny app – Sixer
You can clone the code from Github – Sixer

There is not much in way of explanation. The Shiny app’s use is self-explanatory. You can choose a match type ( Test,ODI or Twenty20), choose a batsman/bowler  from the drop down list and select the plot you would like to seeHere a few sample plots
A. Analyze batsman tab
i) Batsman – Brian Lara , Match Type – Test, Function – Mean Strike Rate
sxr-1ii) Batsman – Shahid Afridi, Match Type –  ODI, Function – Runs vs Balls faced
sxr-2iii)   Batsman – Chris Gayle, Match Type – Twenty20  Function – Moving Average
sxr-3B. Analyze bowler tab

i. Bowler – B S Chandrasekhar, Match Type – Test, Function – Wickets vs Runs
sxr-4ii)  Bowler – Malcolm Marshall, Match Type – Test, Function – Mean Economy Ratesxr-5iii)  Bowler – Sunil Narine, Match Type – Twenty 20, Function – Bowler Wicket Rate
sxr-6
C. Relative performance of batsman (you can select more than 1)
The below plot gives the Mean Strike Rate of batsman. Viv Richards, Brian Lara, Sanath Jayasuriya and David Warner are best strikers of the ball.
sxr-7

Here are some of the great strikers of the ball in ODIs
sxr-8D. Relative performance of bowlers (you can select more than 1)
Finally a look at the famed Indian spin quartet.  From the plot below it can be seen that  B S Bedi  & Venkatraghavan were more economical than Chandrasekhar and Prasanna.
sxr-9

But the latter have a better 4-5 wicket haul than the former two as seen in the plot below

sxr-11Finally a look at the average number of balls to take a wicket by the Top 4 Twenty 20 bowlers.
sxr-10

Do give the Shiny app Sixer a try.

Also see
1. Literacy in India : A deepR dive.
2.  Natural Language Processing: What would Shakespeare say?
3. Revisiting crimes against women in India
4. Informed choices through Machine Learning : Analyzing Kohli, Tendulkar and Dravid
5. Experiments with deblurring using OpenCV
6.  What’s up Watson? Using IBM Watson’s QAAPI with Bluemix, NodeExpress – Part 1
7.  Working with Node.js and PostgreSQL
8. A method for optimal bandwidth usage by auctioning available bandwidth using the OpenFlow Protocol
9.  Latency, throughput implications for the cloud
10.  A closer look at “Robot horse on a Trot! in Android”

To leave a comment for the author, please follow the link and comment on their blog: Giga thoughts ... » R.

R-bloggers.com offers daily e-mail updates about R news and tutorials on topics such as: Data science, Big Data, R jobs, visualization (ggplot2, Boxplots, maps, animation), programming (RStudio, Sweave, LaTeX, SQL, Eclipse, git, hadoop, Web Scraping) statistics (regression, PCA, time series, trading) and more...

Interactive association rules exploration app

$
0
0

(This article was first published on Andrew Brooks - R, and kindly contributed to R-bloggers)

In a previous post, I wrote about what I use association rules for and mentioned a Shiny application I developed to explore and visualize rules. This post is about that app. The app is mainly a wrapper around the arules and arulesViz packages developed by Michael Hahsler.

Features

  • train association rules
    • interactively adjust confidence and support parameters
    • sort rules
    • sample just top rules to prevent crashes
    • post process rules by subsetting LHS or RHS to just variables/items of interest
    • suite of interest measures
  • visualize association rules
    • grouped plot, matrix plot, graph, scatterplot, parallel coordinates, item frequency
  • export association rules to CSV

How to get

Option 1: Copy the code below from the arules_app.R gist

Option2: Source gist directly.

library('devtools')
library('shiny')
library('arules')
library('arulesViz')
source_gist(id='706a28f832a33e90283b')

Option 3: Download the Rsenal package (my personal R package with a hodgepodge of data science tools) and use the arulesApp function:

library('devtools')
install_github('brooksandrew/Rsenal')
library('Rsenal')
?Rsenal::arulesApp

How to use

arulesApp is intended to be called from the R console for interactive and exploratory use. It calls shinyApp which spins up a Shiny app without the overhead of having to worry about placing server.R and ui.R. Calling a Shiny app with a function also has the benefit of smooth passing of parameters and data objects as arguments. More on shinyApp here.

arulesApp is currently highly exploratory (and highly unoptimized). Therefore it works best for quickly iterating on rule training and visualization with low-medium sized datasets. Check out Michael Hahsler’s arulesViz paper for a thorough description of how to interpret the visualizations. There is a particularly useful table on page 24 which compares and summarizes the visualization techniques.

Simply call arulesApp from the console with a data.frame or transaction set for which rules will be mined from:

library('arules') contains Adult and AdultUCI datasets

data('Adult') # transaction set
arulesApp(Adult, vars=40)

data('AdultUCI') # data.frame
arulesApp(AdultUCI)

Here are the arguments:

  • dataset data.frame, this is the dataset that association rules will be mined from. Each row is treated as a transaction. Seems to work OK when a the S4 transactions class from arules is used, however this is not thoroughly tested.
  • bin logical, TRUE will automatically discretize/bin numerical data into categorical features that can be used for association analysis.
  • vars integer, how many variables to include in initial rule mining
  • supp numeric, the support parameter for initializing visualization. Useful when it is known that a high support is needed to not crash computationally.
  • conf numeric, the confidence parameter for initializing visualization. Similarly useful when it is known that a high confidence is needed to not crash computationally.

Screenshots

Association rules list view

Screen Shot 2015-11-29 at 11.36.54 AM

Screen Shot 2015-11-29 at 11.34.51 AM

Scatterplot

Screen Shot 2015-11-29 at 11.40.47 AM

Graph

Screen Shot 2015-11-29 at 11.39.53 AM

Grouped Plot

Screen Shot 2015-11-29 at 11.40.58 AM

Parallel Coordinates

Screen Shot 2015-11-29 at 11.37.30 AM

Matrix

Screen Shot 2015-11-29 at 11.40.39 AM

Item frequency

Screen Shot 2015-11-29 at 11.36.19 AM

Code

To leave a comment for the author, please follow the link and comment on their blog: Andrew Brooks - R.

R-bloggers.com offers daily e-mail updates about R news and tutorials on topics such as: Data science, Big Data, R jobs, visualization (ggplot2, Boxplots, maps, animation), programming (RStudio, Sweave, LaTeX, SQL, Eclipse, git, hadoop, Web Scraping) statistics (regression, PCA, time series, trading) and more...

14 (new) R jobs from around the world (for 2015-11-30)

$
0
0

This is the bi-monthly R-bloggers post (for 2015-11-30) for new R Jobs.

To post your R job on the next post

Just visit this link and post a new R job to the R community (it’s free and quick).

New R jobs

  1. Freelance
    Develop a small Shiny App
    Global Sourcing Group – Posted by Sudhir
    Machanaikanahalli
    Karnataka, India
    17 Nov2015
  2. Full-Time
    Application Developer @ Boulder, Colorado, United States
    The Cadmus Group – Posted by sonia.brightman
    Boulder
    Colorado, United States
    17 Nov2015
  3. Full-Time
    Data Scientist @ New York (> $100K/year)
    Cornerstone Research – Posted by mdecesar
    New York
    New York, United States
    20 Nov2015
  4. Full-Time
    Statistician – Health Economics Outcomes Research @ Utrecht, Netherlands
    Mapi – Posted by andreas.karabis
    Utrecht
    Utrecht, Netherlands
    30 Nov2015
  5. Full-Time
    Insights Analyst @ Auckland, New Zealand
    Experian – Posted by CaroleDuncan
    Auckland
    Auckland, New Zealand
    30 Nov2015
  6. Freelance
    Install test+productionserver + development of Web API for exisiting R Package
    cure-alot – Posted by cure-alot
    Anywhere
    28 Nov2015
  7. Internship
    Content Development Intern @ Cambridge, United States ($15/hour)
    DataCamp – Posted by nickc123
    Cambridge
    Massachusetts, United States
    26 Nov2015
  8. Full-Time
    Data Scientist @ Yakum, Israel
    Intel – Posted by omrimendels
    Yakum
    Center District, Israel
    26 Nov2015
  9. Full-Time
    Junior Data Scientist (R Focus) @ San Mateo, California, United States
    Scientific Revenue – Posted by wgrosso
    San Mateo
    California, United States
    24 Nov2015
  10. Internship
    Trainee Data Analytics & Testing @ Unterföhring, Bayern, Germany
    ProSiebenSat.1 Digital GmbH – Posted by meinhardploner
    Unterföhring
    Bayern, Germany
    24 Nov2015
  11. Full-Time
    Tenure-track Assistant Professor in Computational Biology @ Portland, Oregon, United States
    Oregon Health & Science University – Posted by takabaya
    Portland
    Oregon, United States
    23 Nov2015
  12. Full-Time
    Junior Consumer Insights Analyst @ Düsseldorf, Nordrhein-Westfalen, Germany
    trivago GmbH – Posted by trivago GmbH
    Düsseldorf
    Nordrhein-Westfalen, Germany
    23 Nov2015
  13. Internship
    SHRM Temporary – Certification @ Alexandria, Virginia, United States
    Society for Human Resource Management – Posted byLizPS
    Alexandria
    Virginia, United States
    18 Nov2015
  14. Full-Time
    Senior Analyst @ London, England, United Kingdom
    Bupa – Posted by MCarolan
    London
    England, United Kingdom
    18 Nov2015

Job seekers: please follow the links below to learn more and apply for your job of interest:

(In R-users.com you may see all the R jobs that are currently available)

r_jobs

(you may also look at previous R jobs posts).

Installing RStudio Shiny Server on AWS

$
0
0

(This article was first published on ipub » R, and kindly contributed to R-bloggers)

In this beginner’s level tutorial, you’ll learn how to install Shiny Server on an AWS cloud instance, and how to configure the firewall. It will take just a few minutes!

Why?

Playing around with Shiny is simple enough: all you need is is the R package called shiny, which you can get directly from CRAN.

Making your work available to you mentor is also straight forward: open an account on shinyapps.io, and deploy your application directly from RStudio.

Blogging about your Shiny app is a different story: you might have hundreds of hits in a day, and soon enough your application will hit the max hours available for free on shinyapps.io. As a result, your app will stop working.

Another situation in which you might want to deploy your own Shiny server is if you need access to a database behind a firewall (see Shiny Crud), or if you want to restrict access to your app to people within your sub net (e.g. within your intranet).

Prerequisites

This tutorial builds on the following tutorial:  Setting up an AWS instance for R, RStudio, OpenCPU, or Shiny Server. So we assume that you have a working AWS EC2 Ubuntu instance with a recent version of R installed.

Also, if you are interested in Shiny in general, I recommend this introductory post.

Other References and Links

Shiny Server Open Source is free, and has extensive documentation. However, getting started is not so easy, as it is not always clear which documents apply to Shiny Server Pro (the commercial offering) or Shiny Server Open Source.

The official installation instruction from RStudio, the company behind Shiny, can be found at this link.

And here is a similar guide for digitalocean, a competitor of AWS.

Installing Shiny Server Open Source

This section is not depending on AWS. So I am assuming you have a running Ubuntu instance, and you can access it via ssh. Also, the most recent version of R needs to be installed. If any of this is not the case, see here.

Otherwise, you should see a window like this:

As a first step, we install the R Shiny package. The following command not only installs the package, but also makes sure that it is available for all users on your machine:

sudo su - -c "R -e "install.packages('shiny', repos='https://cran.rstudio.com/')""

This might take a while, as all shiny dependencies are downloaded as well.

Next, you need to install Shiny server itself, by typing the following commands:

sudo apt-get install gdebi-core
wget https://download3.rstudio.org/ubuntu-12.04/x86_64/shiny-server-1.4.1.759-amd64.deb
sudo gdebi shiny-server-1.4.1.759-amd64.deb

You might want to replace the version number of the Shiny Server with the latest available release, as published here. However, leave the ubuntu version (12.04) as is.

When prompted whether you want to install the software package, press y, of course.

Your Shiny server is now installed. But before we can test it, there are two things missing:

  1. we need to install an app
  2. we need to open the port, so your Shiny server can be accessed from the outside world

Install Sample app

To install the sample app that is provided by the Shiny installer, type the following into your console:

<span class="kw">sudo</span> /opt/shiny-server/bin/deploy-example default

Again, type y if prompted.

Configuring Firewall

In order to be able to connect to Shiny Server, you might need to open the port on which Shiny Server listens. By default, this is port 3838.

On AWS, you can open the port by configuring the Security Group of your instance. Go to Instances, select your instance, and then click on the Security Group in the instance’s detail section:

This will bring you to the Security Groups configuration screen. Click on the Inbound tab. By default, AWS instances launched with the wizard have only port 22 open, which is needed to SSH in. No wonder we cannot access our instance!

Click on Edit and add a custom TCP rule, like so:

Open your favorite browser and enter the following address:

http://54.93.177.63:3838/sample-apps/hello/

Replace the IP address (54.93.177.63, in our example) with the public IP address of your instance, which is the same with which you connected to your instance. If everything went fine, you will see something like this:

And that’s it!

Basic Configuration and Administration

Though not the main goal of this post, let’s look at a few basic configuration options.

Start and Stop

To start and stop a Shiny Server, execute these commands:

<span class="kw">sudo</span> start shiny-server
<span class="kw">sudo</span> stop shiny-server

Configuration

Shiny Server is mainly configured via the following file:

/etc/shiny-server/shiny-server.conf

 We can use the minimalistic text editor Nano to edit the configuration file. Type

sudo nano /etc/shiny-server/shiny-server.conf

You should see something like this:


For example, you could now change the port to 80, letting your users connect without specifying a port, e.g. like so:

http://54.93.177.63/sample-apps/hello/

To do that, you need to perform the following steps:

  1. in Nano, change the port to 80
  2. Save the file by hitting Ctrl+X and answering Yes
  3. Restarting the server by typing
    <span class="kw">sudo</span> restart shiny-server
  4. Opening your port 80 in the AWS EC2 Security Group by adding a custom TCP rule for port 80, as described above


I hope you enjoyed this tutorial. In the next post, we’ll describe how to enable secure https connections in Shiny Server Open Source, and we’ll explain why you would want to do this.

The post Installing RStudio Shiny Server on AWS appeared first on ipub.

To leave a comment for the author, please follow the link and comment on their blog: ipub » R.

R-bloggers.com offers daily e-mail updates about R news and tutorials on topics such as: Data science, Big Data, R jobs, visualization (ggplot2, Boxplots, maps, animation), programming (RStudio, Sweave, LaTeX, SQL, Eclipse, git, hadoop, Web Scraping) statistics (regression, PCA, time series, trading) and more...

How to Search PubMed with RISmed package in R

$
0
0

(This article was first published on DataScience+, and kindly contributed to R-bloggers)

In the last tutorial, we developed a simple shiny R App to provide a tool to collect and analyze PubMed data. There was some interest in learning more about RISmed itself, so I’ll back up a little and present some of the core RISmed package.

About PubMed and RISmed

PubMed is a public query database of published journal articles and other literature maintained and made available by the National Institutes of Health. The RISmed packages extracts content from the Entrez Programming Utilities (E-Utilities) interface to the PubMed query and database at NCBI into R. You will find great tutorials to get RISmed up and running by checking out this introduction or this very nice post by some dude named Dave Tang. For raw code, you can find Stephanie Kovalchik’s terrific RISmed github page here.

Introducing EUtilsSummary

RISmed allows us to call the EUtilsSummary() function to produce an object for us to analyze. EUtilsSummary() is overloaded with many arguments. First, we send a character string in quotes as the word/phrase/acronymn/author for which we wish to search PubMed. Here we will stick with type=esearch.

You can click the links above to learn more about arguments to EUtilsSummary(), here we are choosing PubMed, specifying a date range, and stopping after 500 publications are found.

library(RISmed)
res <- EUtilsSummary("pinkeye", type="esearch", db="pubmed", datetype='pdat', mindate=2000, maxdate=2015, retmax=500)

Now we have an object called res of class “Medline”. We can call QueryCount() to see how many publications we found.

QueryCount(res)
23

There are 23 publications in PubMed between 2000 and 2015 that contain the word “pinkeye”.

Introducing EUtilsGet

The Medline class collects pertinent information about the publications in our search, and stores the information conveniently for analysis. We can access our data by calling EUtilsGet(). Here we create a new object t that is a character vector containing all the publication titles by using the EUtilsGet() function inside ArticleTitle(). We can access them like any other character vector.

t<-ArticleTitle(EUtilsGet(res))

typeof(t)
"character"

head(t,1)
"Infectious bovine keratoconjunctivitis (pinkeye)."

t[2]
"Moraxella spp. isolated from field outbreaks of infectious bovine keratoconjunctivitis: a retrospective study of case submissions from 2010 to 2013."

res contains a lot of data relating to dates. For instance, we can access the year a publication was received, or the year it was accepted into the PubMed database.

y <- YearPubmed(EUtilsGet(res))
r <- YearReceived(EUtilsGet(res))

y
2015 2014 2013 2012 2011 2011 2011 2010 2010 2010 2010 2008 2008 2008 2008 2007 2007 2007 2007 2006 2005 2004 2002

r
NA   NA 2012 2012 2011 2011   NA 2010   NA   NA   NA   NA 2008 2007   NA 2007 2007 2007   NA   NA 2004   NA   NA

Be mindful of your data! If you make a plot of the number of documents received for publication in a given year, you can easily be missing many publications that simply don’t have that info recorded (this happens quite often). I suggest using YearPubmed, because it seems to have very few (if any) NA’s.

It’s a little tough to see a pattern in the YearPubmed results above, here is code to make a barplot.

library(ggplot)
date()
count<-table(y)
count<-as.data.frame(count)
names(count)<-c("Year", "Counts")
num <- data.frame(Year=count$Year, Counts=cumsum(count$Counts))
num$g <- "g"
names(num) <- c("Year", "Counts", "g")
q <- qplot(x=Year, y=Counts, data=count, geom="bar", stat="identity")
q <- q + ggtitle(paste("PubMed articles containing '", g,            "' ", "= ", max(num$Counts), sep="")) +
     ylab("Number of articles") +
     xlab(paste("Year n Query date: ", Sys.time(), sep="")) +
     labs(colour="") +
     theme_bw()
q

Here is the plot we made.
Rplot021

The interesting thing about this (slightly contrived) plot is that there is a sudden increase in publications in 2007 that lasts for a few years. This is the sort of thing we might want to investigate. We might take a look at term frequencies to see if there were any differences between 2006 and 2007.

Introducing text mining

Here is a function that takes a year as an argument and returns the twenty most frequent words in the abstracts for that year, after some manipulations.

library(qdap)
myFunc<-function(argument){
articles1<-data.frame('Abstract'=AbstractText(fetch), 'Year'=YearPubmed(fetch))
abstracts1<-articles1[which(articles1$Year==argument),]
abstracts1<-data.frame(abstracts1)
abstractsOnly<-as.character(abstracts1$Abstract)
abstractsOnly<-paste(abstractsOnly, sep="", collapse="")
abstractsOnly<-as.vector(abstractsOnly)
abstractsOnly<-strip(abstractsOnly)
stsp<-rm_stopwords(abstractsOnly, stopwords = qdapDictionaries::Top100Words)
ord<-as.data.frame(table(stsp))
ord<-ord[order(ord$Freq, decreasing=TRUE),]
head(ord,20)
}

Let’s run our function twice and compare.

oSix<-myFunc(2006)
oSeven<-myFunc(2007)
all<-cbind(oSix, oSeven)
names(all)<-c("2006","freq","2007","freq")

all
                   2006 freq          2007 freq
10               bovine    6         bovis   12
38           infectious    6        calves   11
42 keratoconjunctivitis    6             m    8
60                  qtl    4           ibk    7
14          centimorgan    3     moraxella    7
24                    f    3       vaccine    6
32             hereford    3       control    5
50            offspring    3     cytotoxin    5
2                  also    2      isolates    5
4                 angus    2       pinkeye    5
5               animals    2   recombinant    5
13               cattle    2             s    5
16           chromosome    2      analysis    4
17                 cows    2    associated    4
20              disease    2             b    4
22             evidence    2      efficacy    4
27           fstatistic    2          gene    4
31                group    2          mbxa    4
33           identified    2 phospholipase    4
41             interval    2     pilinmbxa    4

In addition to recognizing that pinkeye seems to have nothing to do with second-graders, there does seem to be a difference in the types of words that are most frequent. Articles from 2006 have words associated with generational studies of different breeds like “offspring”, “centimorgan”, “angus” and “hereford”, “f-statistic”, “group”, and “interval”. In contrast, 2007 articles have biochemistry looking terms like “ibk”, “Moraxella”, “cytotoxin”, “isolates”, “recombinant”, “gene”, “mbxa”, “phospholipase”, and even perhaps “vaccine”. Maybe the spike in articles is the result of a discovery concerning the host pathways controlled by pinkeye bacteria toxins, or the emergence of a new strategy for treatment that targets a bacterial pathway.

A good strategy might be to search words like “Moraxella” or “mbxa” to see if there is a corresponding spike before 2007. Even “bovis” might be a candidate to search 2006 for a discovery that led to the spike in scientific interest. (It doesn’t seem like the kind of topic that would warrant a nyTimes API scrub or twitter feeds, maybe in the rural Midwest only). We could investigate funding sources by searching NIH grant titles, or searching rural news sources for clues.

EUtilsGet subtleties

Another strategy in this particular case might be reviewing publications by a researcher who specializes in pinkeye. Author(EUtilsGet()) returns a list of data frames, so we need to use an inline function to extract all the names.

auths<-Author(EUtilsGet(res))
typeof(auths)
"list"

auths[3]
   LastName  ForeName Initials order
1 Kizilkaya     Kadir        K     1
2      Tait Richard G       RG     2
3   Garrick  Dorian J       DJ     3
4  Fernando   Rohan L       RL     4
5     Reecy   James M       JM     5

Last<-sapply(auths, function(x)paste(x$LastName))
auths2<-as.data.frame(sort(table(unlist(Last)), dec=TRUE))
names(auths2)<-c("name")

head(auths2)
         name
Angelos     5
Ball        3
O'Connor    3
Reecy       3
Tait        3
Casas       2

Maybe Dr. Angelos has written a review after 2006 that describes the change in interest in bovine pinkeye.

Until next time!

To leave a comment for the author, please follow the link and comment on their blog: DataScience+.

R-bloggers.com offers daily e-mail updates about R news and tutorials on topics such as: Data science, Big Data, R jobs, visualization (ggplot2, Boxplots, maps, animation), programming (RStudio, Sweave, LaTeX, SQL, Eclipse, git, hadoop, Web Scraping) statistics (regression, PCA, time series, trading) and more...

RcppCCTZ 0.0.1

$
0
0

(This article was first published on Thinking inside the box , and kindly contributed to R-bloggers)

A new package! A couple of weeks ago folks at Google released CCTZ: a C++ library for translating between absolute and civil times using the rules of a time zone. It requires only a proper C++11 compiler and the standard IANA time zone data base which standard Unix, Linux, OS X, … computers tend to have in /usr/share/zoneinfo.

And as the world needs nothing more than additional date, time, or timezones libraries, I started to quickly create a basic R wrapper package. This stalled as the original version of CCTZ used an __int128 for extended precision. That is not only not portable, but also prohibits compilation on baby computers still running a 32 OS (such as my trusted X1 laptop merrily plugging along with 4 gb of ram under Linux). Hence I filed an issue ticket which, lo and behold, got resolved two days ago.

And so now we have a shiny new RcppCCTZ package on CRAN in a very basic version 0.0.1. It happily runs all the original examples from CCTZ as e.g. this one:

// from examples/hello.cc
//
// [[Rcpp::export]]
int helloMoon() {
    cctz::TimeZone syd;
    if (!cctz::LoadTimeZone("Australia/Sydney", &syd)) return -1;

    // Neil Armstrong first walks on the moon
    const auto tp1 = cctz::MakeTime(1969, 7, 21, 12, 56, 0, syd);

    const std::string s = cctz::Format("%F %T %z", tp1, syd);
    Rcpp::Rcout << s << "n";

    cctz::TimeZone nyc;
    cctz::LoadTimeZone("America/New_York", &nyc);

    const auto tp2 = cctz::MakeTime(1969, 7, 20, 22, 56, 0, nyc);
    return tp2 == tp1 ? 0 : 1;
}

which results in

R> library(RcppCCTZ)
R> helloMoon()
1969-07-21 12:56:00 +1000
[1] 0
R>

indicating that the two civil times in fact correspond to the same absolute times when Armstrong walked on the moon.

If you want to learn more about CCTZ, there was a corresponding talk CppCon (Youtube, Slides).

I hope this provides a starting point for some new interesting computation on time from R. Collaboration welcome via the RcppCCTZ GitHub repo.

This post by Dirk Eddelbuettel originated on his Thinking inside the box blog. Please report excessive re-aggregation in third-party for-profit settings.

To leave a comment for the author, please follow the link and comment on their blog: Thinking inside the box .

R-bloggers.com offers daily e-mail updates about R news and tutorials on topics such as: Data science, Big Data, R jobs, visualization (ggplot2, Boxplots, maps, animation), programming (RStudio, Sweave, LaTeX, SQL, Eclipse, git, hadoop, Web Scraping) statistics (regression, PCA, time series, trading) and more...

Inequality measures in the World Development Indicators

$
0
0

(This article was first published on Peter's stats stuff - R, and kindly contributed to R-bloggers)

World Development Indicators

After my last post on deaths from assault, I got a few comments both on and off-line asking for exploration of developing country issues, in contrast to the OECD focus of the previous post. I’d always intended at some point to do something with the World Bank’s World Development Indicators so now seems a good time to at least get started.

“World Development Indicators (WDI) is the primary World Bank collection of development indicators, compiled from officially recognized international sources. It presents the most current and accurate global development data available, and includes national, regional and global estimates”

I’ll be analysing the data using Vincent Arel-Bundock’s {WDI} R package which makes it super easy to grab data via the World Bank’s Application Programming Interface, including fast searching a cached version of the indicator names and of course downloading the actual data into an R session. With that search ability and the Bank’s own page with its categorisations of indicators it wasn’t hard to find data that I was interested in.

However I quickly found myself doing some repetitive tasks – downloading a dataset and turning them into a standard faceted time series plot. Following the DRY (Don’t Repeat Yourself) fundamental principle of programming I decided this phase of exploration was more suited to a graphic user interface so I spun up this web-app using Shiny.

The app has my standard plot I was making each time I looked at a new indicator:
screen1

and a responsive, fast, searchable table of the available indicators:
screen1

The source code is available in the <source> branch of my blog repository if anyone wants to hunt it down.

As well as producing my standard plot quickly for me, putting all the 3,700 indicators into a JavaScript DataTable gave me even more convenient searching and navigating. While developing that app I did a one-off download all 7,145 available indicators, which is the number of rows returned in this snippet of code:

library(WDI)
search_results <- WDIsearch("")
nrow(search_results)

This was convenient to have a local copy of all that data (1.1GB of download – took about 10 hours – but only about 70MB when saved in R’s super efficient .rda format), but the main motivation for doing this was identifying which series actually have data. Only the 3,700 series with at least one row of data on 3 December 2015 are listed in my Shiny app. The app does download the live data, not using my cached copy; this obviously makes the performance quite slow (about 10 – 20 seconds of apparent unresponsiveness when downloading a dataset) but saves me having a very large shiny app on a hosted server, and ensures the data are current.

Inequality measures

There are five measures that I found in the WDI that are related to income inequality:

Indicator code Indicator name
SI.POV.GINI Gini coefficient of income
SI.DST.10TH.10 Income share held by highest 10%
SI.DST.05TH.20 Income share held by highest 20
SI.DST.FRST.10 Income share held by lowest 10%
SI.DST.FRST.20 Income share held by lowest 20%

With these, I’ll also create two other common measures: the P80P20 and P90P10 measures. The first of these is the income share of the highest earning 20% divided by that of the lowest earning 20%; the second is the same but for the 10th percentile instead.

I’ve talked a bit about the definitions of these measures in an earlier post.

Once we’ve brought in the data and created our two new variables we can have a look at what we’ve got. I do this by picking six countries at random and looking at the full data for those six:

time-plot

From just this example (and a few others I ran and some back up analysis but won’t bother to show) a few things suggest themselves:

  • country data are pretty much equally complete across the measures. For example, Fiji has values for two years for every measure; France has about 10; etc.
  • the variables change over time in consistent ways (not surprising given they are all based on the same underlying data). For example, as the proportion of the country’s income that goes to the bottom percentile (P10) in Cyprus goes down, so does the P20; and the Gini coefficient, P90 (income share of the top 10%) and P80 (income share of the top 20%) all go up together.
  • P90P10 and P80P20 are the measures in which it is hardest to detect variation visually on the untransformed scale. For example, Central African Republic’s high inequality dominates the scale in each measure’s row, but only in P90P10 and P80P20 does it do so so much that it’s difficult to see variation at all in the other countries.

Looking at the average values for each measure over time gives a rough sense of their correlation. In the pairs plot below, each of the 156 points represents a single country’s trimmed mean value on a particular inequality measure over all the years where they had data. Countries aren’t comparable to eachother (as they have different years of data), but variables are (because countries have observations on all measures for the same years, for that particular country).

Bhutan is excluded from this plot because its average values on P90P10 and P80P20 were so extreme other variation couldn’t be seen. Suriname is excluded because it only has a value for Gini coefficient, not the other variables. A small number of other excluded countries (including New Zealand!) are absent from the entire World Bank dataset on these variables.

pairs-plot

Overall, I’m happy that the measures of the Gini coefficient and of the share going to the richest X% are highly correlated. As I’ve mentioned before, I can see the argument (by Thomas Picketty) that the proportion of national income going to the richest X% is a good measure for interpetability and ease of explanation, but I disagree with some of the other criticisms of the Gini coefficient. However, I’m more convinced than ever that Picketty is correct that the P90P10 and P80P20 measures aren’t good choices, because of the instability that comes from dividing a large number by a small number.

Here’s the code in R for the inequality plots.

library(WDI)
library(ggplot2)
library(scales)
library(dplyr)
library(tidyr)
library(GGally)   # for ggplot pairs plot
library(showtext) # for fonts

# import fonts
font.add.google("Poppins", "myfont")
showtext.auto()

# import data from the World Bank
gini <- WDI(indicator = "SI.POV.GINI", end = 2015, start = 1960)
p90 <- WDI(indicator = "SI.DST.10TH.10", end = 2015, start = 1960)
p80 <- WDI(indicator = "SI.DST.05TH.20", end = 2015, start = 1960)
p10 <- WDI(indicator = "SI.DST.FRST.10", end = 2015, start = 1960)
p20 <- WDI(indicator = "SI.DST.FRST.20", end = 2015, start = 1960)


# merge and tidy up
inequality <- merge(gini, p10, all = TRUE) %>%
   merge(p20, all = TRUE) %>%
   merge(p80, all = TRUE) %>%
   merge(p90, all = TRUE) %>%
   # create synthetic variables
   mutate(P90P10 = SI.DST.10TH.10 / SI.DST.FRST.10,
          P80P20 = SI.DST.05TH.20 / SI.DST.FRST.20) %>%
   select(-iso2c) %>%
   # gather into long form
   gather(variable, value, -country, -year) %>%
   filter(!is.na(value)) %>%
   # rename the variables:
   mutate(variable = gsub("SI.DST.FRST.", "P", variable),
          variable = gsub("SI.DST.10TH.10", "P90 (Share of richest 10%)", variable),
          variable = gsub("SI.DST.05TH.20", "P80 (Share of richest 20%)", variable),
          variable = gsub("SI.POV.GINI", "Gini", variable, fixed = TRUE))

all_countries <- unique(inequality$country) # 158 countries

#---------------all 7 measures over time?-------------
# example plot of 6 random countries over time
svg("..http://ellisp.github.io/img/0022-eg-countries.svg", 8, 8)
set.seed(127)
inequality %>%
   filter(country %in% sample(all_countries, 6, replace = FALSE)) %>%
   mutate(variable = str_wrap(variable, 20)) %>%
   ggplot(aes(x = year, y = value)) +
   geom_point() +
   geom_line() +
   facet_grid(variable ~ country, scales = "free_y")
dev.off()

# average observations per country and variable:
inequality %>%
   group_by(variable, country) %>%
   summarise(ObsPerCountry = length(value)) %>%
   group_by(variable) %>%
   summarise(AveObsPerCountry = mean(ObsPerCountry),
             Countries = length(ObsPerCountry))

#---------trimmed mean for each country on each variable, in wide format----------
inequality_aves <- inequality %>%
   group_by(country, variable) %>%
   summarise(value = mean(value, tr = 0.2)) %>%
   spread(variable, value) %>%
   # make the column names legal
   data.frame(stringsAsFactors = FALSE, check.names = TRUE)
names(inequality_aves) <- gsub(".", "", names(inequality_aves), fixed = TRUE)
   
# what are the extreme values of those averages of ratios:
inequality_aves %>%
   arrange(P90P10) %>%
   tail()

# Draw pairs plots
svg("..http://ellisp.github.io/img/0022-pairs.svg", 12, 12)
inequality_aves %>%
   # Bhutan has an average P90P10 of 600 so we exclude it
   filter(country != "Bhutan") %>%
   select(-country) %>%
   ggpairs() 
dev.off()

To leave a comment for the author, please follow the link and comment on their blog: Peter's stats stuff - R.

R-bloggers.com offers daily e-mail updates about R news and tutorials on topics such as: Data science, Big Data, R jobs, visualization (ggplot2, Boxplots, maps, animation), programming (RStudio, Sweave, LaTeX, SQL, Eclipse, git, hadoop, Web Scraping) statistics (regression, PCA, time series, trading) and more...

My First (R) Shiny App: An Annotated Tutorial

$
0
0

(This article was first published on Quality and Innovation » R, and kindly contributed to R-bloggers)
Image Credit: Doug Buckley of http://hyperactive.to

Image Credit: Doug Buckley of http://hyperactive.to

I’ve been meaning to learn Shiny for 2 years now… and thanks to a fortuitous email from @ImADataGuy this morning and a burst of wild coding energy about 5 hours ago, I am happy to report that I have completely fallen in love again. The purpose of this post is to share how I got my first Shiny app up and running tonight on localhost, how I deployed it to the http://shinyapps.io service, and how you can create a “Hello World” style program of your own that actually works on data that’s meaningful to you.

If you want to create a “Hello World!” app with Shiny (and your own data!) just follow these steps:

0. Install R 3.2.0+ first! This will save you time.
1. I signed up for an account at http://shinyapps.io.
2. Then I clicked the link in the email they sent me.
3. That allowed me to set up my https://radziwill.shinyapps.io location.
4. Then I followed the instructions at https://www.shinyapps.io/admin/#/dashboard
(This page has SPECIAL SECRET INFO CUSTOMIZED JUST FOR YOU ON IT!!) I had lots 
of problems with devtools::install_github('rstudio/shinyapps') - Had to go 
into my R directory, manually delete RCurl and digest, then 
reinstall both RCurl and digest... then installing shinyapps worked.
Note: this last command they tell you to do WILL NOT WORK because you do not have an app yet! 
If you try it, this is what you'll see:
> shinyapps::deployApp('path/to/your/app')
Error in shinyapps::deployApp("path/to/your/app") : 
C:UsersNicoleDocumentspathtoyourapp does not exist
5. Then I went to http://shiny.rstudio.com/articles/shinyapps.html and installed rsconnect.
6. I clicked on my name and gravatar in the upper right hand corner of the 
https://www.shinyapps.io/admin/#/dashboard window I had opened, and then clicked 
"tokens". I realized I'd already done this part, so I skipped down to read 
"A Demo App" on http://shiny.rstudio.com/articles/shinyapps.html
7. Then, I re-installed ggplot2 and shiny using this command:
install.packages(c('ggplot2', 'shiny'))
8. I created a new directory (C:/Users/Nicole/Documents/shinyapps) and used
setwd to get to it.
9. I pasted the code at http://shiny.rstudio.com/articles/shinyapps.html to create two files, 
server.R and ui.R, which I put into my new shinyapps directory 
under a subdirectory called demo. The subdirectory name IS your app name.
10. I typed runApp("demo") into my R console, and voila! The GUI appeared in 
my browser window on my localhost.
-- Don't just try to close the browser window to get the Shiny app 
to stop. R will hang. To get out of this, I had to use Task Manager and kill R.
--- Use the main menu, and do Misc -> Stop Current Computation
11. I did the same with the "Hello Shiny" code at http://shiny.rstudio.com/articles/shinyapps.html. 
But what I REALLY want is to deploy a hello world app with MY OWN data. You know, something that's 
meaningful to me. You probably want to do a test app with data that is meaningful to you... here's 
how you can do that.
12. A quick search shows that I need jennybc's (Github) googlesheets package to get 
data from Google Drive viewable in my new Shiny app.
13. So I tried to get the googlesheets package with this command:
devtools::install_github('jennybc/googlesheets')
but then found out it requires R version 3.2.0. I you already have 3.2.0 you can skip 
to step 16 now.
14. So I reinstalled R using the installr package (highly advised if you want to 
overcome the agony of upgrading on windows). 
See http://www.r-statistics.com/2013/03/updating-r-from-r-on-windows-using-the-installr-package/
for info -- all it requires is that you type installR() -- really!
15. After installing R I restarted my machine. This is probably the first time in a month that 
I've shut all my browser windows, documents, spreadsheets, PDFs, and R sessions. I got the feeling 
that this made my computer happy.
16. Then, I created a Google Sheet with my data. While viewing that document, I went to 
File -> "Publish to the Web". I also discovered that my DOCUMENT KEY is that 
looooong string in the middle of the address, so I copied it for later:
1Bs0OH6F-Pdw5BG8yVo2t_VS9Wq1F7vb_VovOmnDSNf4
17. Then I created a new directory in C:/Users/Nicole/Documents/shinyapps to test out 
jennybc's googlesheets package, and called it jennybc
18. I copied and pasted the code in her server.R file and ui.R file
from https://github.com/jennybc/googlesheets/tree/master/inst/shiny-examples/01_read-public-sheet 
into files with the same names in my jennybc directory
19. I went into my R console, used getwd() to make sure I was in the
C:/Users/Nicole/Documents/shinyapps directory, and then typed
 runApp("jennybc")
20. A browser window popped up on localhost with her test Shiny app! I played with it, and then 
closed that browser tab.
21. When I went back into the R console, it was still hanging, so I went to the menu bar 
to Misc -> Stop Current Computation. This brought my R prompt back.
22. Now it was time to write my own app. I went to http://shiny.rstudio.com/gallery/ and
found a layout I liked (http://shiny.rstudio.com/gallery/tabsets.html), then copied the 
server.R and ui.R code into C:/Users/Nicole/Documents/shinyapps/my-hello -- 
and finally, tweaked the code and engaged in about 100 iterations of: 1) edit the two files, 
2) type runApp("my-hello") in the R console, 3) test my Shiny app in the 
browser window, 4) kill browser window, 5) do Misc -> Stop Current Computation 
in R. ALL of the computation happens in server.R, and all the display happens in ui.R:

server.R:

library(shiny)
library(googlesheets)
library(DT)

my_key <- "1Bs0OH6F-Pdw5BG8yVo2t_VS9Wq1F7vb_VovOmnDSNf4"
my_ss <- gs_key(my_key)
my_data <- gs_read(my_ss)

shinyServer(function(input, output, session) {
 output$plot <- renderPlot({
 my_data$type <- ordered(my_data$type,levels=c("PRE","POST"))
 boxplot(my_data$score~my_data$type,ylim=c(0,100),boxwex=0.6)
 })
 output$summary <- renderPrint({
 aggregate(score~type,data=my_data, summary)
 })
 output$the_data <- renderDataTable({
 datatable(my_data)
 })

})

ui.R:

library(shiny)
library(shinythemes)
library(googlesheets)

shinyUI(fluidPage(
 
 # Application title
 titlePanel("Nicole's First Shiny App"),
 
 # Sidebar with controls to select the random distribution type
 # and number of observations to generate. Note the use of the
 # br() element to introduce extra vertical spacing
 sidebarLayout(
 sidebarPanel(
     helpText("This is my first Shiny app!! It grabs some of my data 
from a Google Spreadsheet, and displays it here. I      
also used lots of examples from"),
     h6(a("http://shiny.rstudio.com/gallery/", 
href="http://shiny.rstudio.com/gallery/", target="_blank")),
     br(),
     h6(a("Click Here for a Tutorial on How It Was Made", 
href="http://qualityandinnovation.com/2015/12/08/my-first-shin     
y-app-an-annotated-tutorial/",
      target="_blank")),
      br()
 ),
 
 # Show a tabset that includes a plot, summary, and table view
 # of the generated distribution
 mainPanel(
    tabsetPanel(type = "tabs", 
    tabPanel("Plot", plotOutput("plot")), 
    tabPanel("Summary", verbatimTextOutput("summary")), 
    tabPanel("Table", DT::dataTableOutput("the_data"))
 )
 )
 )
))


23. Once I decided my app was good enough for my practice round, it was time to 
deploy it to the cloud.
24. This part of the process requires the shinyapps and dplyr 
packages, so be sure to install them:

devtools::install_github('hadley/dplyr')
library(dplyr)
devtools::install_github('rstudio/shinyapps')
library(shinyapps)
25. To deploy, all I did was this: setwd("C:/Users/Nicole/Documents/shinyapps/my-hello/")
deployApp()

CHECK OUT MY SHINY APP!!

To leave a comment for the author, please follow the link and comment on their blog: Quality and Innovation » R.

R-bloggers.com offers daily e-mail updates about R news and tutorials on topics such as: Data science, Big Data, R jobs, visualization (ggplot2, Boxplots, maps, animation), programming (RStudio, Sweave, LaTeX, SQL, Eclipse, git, hadoop, Web Scraping) statistics (regression, PCA, time series, trading) and more...

The Annual Japanese R user conference “Japan.R 2015”

$
0
0

(This article was first published on Data science & Software development » R, and kindly contributed to R-bloggers)

The annual Japanese R user conference “Japan.R” was held in Dec 5th, 2015 at Recuit Ginza 8 Bldg and attended by more than 200 R users. In this post, I will share some presentations in English.

IMG_20151205_133705

Talk sessions

Machine Learning and Data mining trends in CET project

Shinichi Takayanagi from Recruit Communications and Recruit Lifestyle talked about Real-time Analysis Platform “CET” (Capture Everything) developed by Recruit group. His team utilized Apache Spark, Google Cloud Platform, Leaflet and some tools to provide Real-Time analysis dashboard which displays reservation history of Japanese major hotel reservation service “Jaran“. Also, his team developed prediction engine for web form. The engine predict and set default value in hotel reservation forms (payment type and etc.) to improve customer satisfaction. Details of CEP are described in this article.

IMG_20151205_135331

Plotting Data on Map in R with Leaflet

Kazuhiro Maeda (@kazutan) gave a tutorial presentation for visualizing geolocation data using Leaflet. The R package leaflet enables us to visualize geolocation data (Circles, Polygons, Polylines and etc.) on the Open Street map. And it does not require Javascript coding skill. Generated maps can be exported as an HTML file and embedded into your blog, shinyapps or RPubs. He demonstrated a typhoon path visualization app and a restaurant map for conference attendees. Also he introduced some experimental features like MiniMaps, ScaleBars, Measures and AwesomeMarkers (These features are available only in Github)

IMG_20151205_143333

Slides: Plotting Data on Map in R with Leaflet

Non-tabular Data processing using Purrr

@sinhrks a committer of Pandas gave a presentation about purrr (pronounce as PU-RAA? *please let us know correct pronunciation* ).
The purrr is a functional programming tool and a data processing package. The package enables us to apply functions to dataframe in a smart way. He recommended to use purrr with a machine learning package caret to create/evaluate a model, and a visualization package ggfortify for creating charts.

Slides: Non-tabular Data processing using Purrr

Room and Shirt and Me

Kazuya Wada (@wdkz) a Data Mining Engineer gave a presentation named “Room and Shirt and Me” (Originally it is a pop music sung by Aya Matuura). In his presentation, he talked about a Web application made with shiny, rApache and DeployR. This combination resembles “Room”, “Shirt” and “Me”, according to him (I cannot understand why…).
He demonstrated his web application running on the deployR which provides words that have similar meaning using a text analysis tool Word2Vec. He recommended creating a web application with the DeployR is the best solution to share your deliverables with people who cannot code. Also, an audience said there is a similar tool named OpenCPU and it has flexible output features.

Lightning Talks (Small presentations)

More than 20 people gave a presentation. (And that took 2 hours!) I will share some of the presentations spoken in LT session.

gepuro task views

Atsushi Hayakawa (@gepuro) a host of Japan.R wanted to know useful R packages but not known by everyone. Also, he wanted to search R packages hosted on the Github. That’s why he developed a website named “gepuro task views“. His website displays useful R packages clawed from Github on a batch process and automatically categorized with his algorithm.

Hot topics of Julia

Kenta Sato (@bicycle1885) shared hot topics of Julia. Also he attended the Julia summer of code and developed features/packages for Julia with his teammates. He stated nowadays 700-800 add-on packages are available, also he introduced some topics; threading feature which was developed by Intel; FRB released financial economics model available on Julia.

Estimating the effect of advertising with Machine learning

Shota Yasui (@housecat442) from Cyber Agent implemented an algorithm for predicting effects of advertising. Most marketers believe to advertise surf board in California is more effective than in Arizona. But it has a selection bias and cannot compare them fairly. So, he implemented an algorithm from the thesis Varian (2014) with a data set of store sales provided by Kaggle. In his program, he used Gradient Boosted Decision Tree with xgboost package and estimated the ad effect.


Naming with R

@hoxo_m got his baby in this October. His wife request him to give a name for his baby, but he was not good at naming. So, he decided to create an R program which generates an appropriate baby name from millions of names. His program scrapes data from a web service “enanae.net” which suggests baby names as a good fortune using rvest and lambdaR packages. Finally his wife chose his baby name from a list created by his R program.

SparkR and Parquet

Ryuji Tamagawa (@tamagawa_ryuji) a translator and he translates Japanese version of O’relly books. He introduced a his new book Japanese version of “Advanced Analytics with Spark” and demonstrated some SparkR codes. Although his slot was only 5 minutes, he could conduct a demonstration of large data manipulation from his RStudio and proved SparkR is a fast and easy solution.

SeekR Annual Search Trends Report 2015

Takekatsu Hiramura (@hiratake55) a webmaster of “SeekR” a search engine for R users. In his presentation, he gathered frequent search keywords in 2015 and introduced some tools, articles and R packages like a “fft“, “Kriging“, “RMarkdown“, “RPresentation“, “bitcoin” and etc.


Party

Pizza party and Izakaya party were held after the conference and we discussed through midnight.

PANO_20151205_225234

Conclusion

Japan.R was a great opportunity for sharing knowledge and creating a network for me. Please let us know if you want to attend or give a presentation in the next Japan.R.

Overall presentations in Japanese are listed on this blog.

To leave a comment for the author, please follow the link and comment on their blog: Data science & Software development » R.

R-bloggers.com offers daily e-mail updates about R news and tutorials on topics such as: Data science, Big Data, R jobs, visualization (ggplot2, Boxplots, maps, animation), programming (RStudio, Sweave, LaTeX, SQL, Eclipse, git, hadoop, Web Scraping) statistics (regression, PCA, time series, trading) and more...

Scholar indices (h-index and g-index) in PubMed with RISmed

$
0
0

(This article was first published on DataScience+, and kindly contributed to R-bloggers)

Scholar indices are intended to measure the contributions of authors to their fields of research. Jorge E. Hirsch suggested the h-index in 2005 as an author-level metric intended to measure both the productivity and citation impact of the publications of an author. An author has index h if h of his or her N papers have at least h citations each, and the other (N-h) papers have no more than h citations each.

In response to a comment, we will use our trusty RISmed package and the PubMed database to develop a script for calculating an h-index, as well as two similar metrics, the m-quotient, and g-index. Here is the code to conduct the search, the citations information is stored in the EUtilitiesSummary() as Cited().

x <- "Yi-Kuo Yu"
res <- EUtilsSummary(x, type="esearch", db="pubmed", datetype='pdat', mindate=1900, maxdate=2015, retmax=500)
citations <- Cited(res)
citations <- as.data.frame(citations)

h-index

Calculating the h-index is just a matter of cleverly arranging the data. Above, we created a data frame with one column containing all the values of Cited() in our search. We will sort them in descending order, then make a new column with the index values. The highest index value that is greater than the number of citations is that author’s h-index. The following code will return that index number.

citations <- citations[order(citations$citations,decreasing=TRUE),]
citations <- as.data.frame(citations)
citations <- cbind(id=rownames(citations),citations)
citations $id<- as.character(citations$id)
citations $id<- as.numeric(citations$id)
hindex <- max(which(citations$id<=citations$citations))

hindex
12

Here is the data frame we created above that shows that Dr. Yi-Kuo Yu has an h-index of 12, since he has 12 publications with 12 or more citations.

citations

id citations
1       181
2        62
3        34
4        31
5        23
6        19
7        19
8        18
9        14
10       14
11       13
12       13
13       10
14        8

m-quotient

Although the h-index is a useful metric to measure an author’s impact, it has some disadvantages. For instance, a long, less impactful career will typically outscore a superstar junior scientist. For these cases, the m-quotient divides the h-index by the number of years since the author’s first publication. In this sense it is a way to normalize by career span.

y <- YearPubmed(EUtilsGet(res))
low <- min(y)
high <- max(y)
den <- high-low
mquotient <- hindex/den

mquotient
0.92

g-index

Another weakness of the h-index is that doesn’t take into account highly cited publications. It doesn’t matter if an author has a few highly cited publications, he gets the same h-index as a relatively obscure author. The g-index was developed to address this situation. The g-index is the largest rank (where papers are arranged in decreasing order of the number of citations they received) such that the first g papers have (together) at least g^2 citations”. Here is code to calculate the g-index.

citations$square <- citations$id^2
citations$sums <- cumsum(citations$citations)
gindex <- max(which(citations$square<citations$sums))

gindex
22

We made two new columns, one for the squares of the index column and one for the cumulative sum of the citations in descending order. Similar to the h-index, we need the index of the highest squared index value that is less than the cumulative sum. Our output with the two new columns below shows that Dr. Yu has a g-score of 22, based on the fact that especially his top two publications have many citations.

citations

 id citations square sums
  1       181      1  181
  2        62      4  243
  3        34      9  277
  4        31     16  308
  5        23     25  331
  6        19     36  350
  7        19     49  369
  8        18     64  387
  9        14     81  401
 10        14    100  415
 11        13    121  428
 12        13    144  441
 13        10    169  451
 14         8    196  459
 15         7    225  466
 16         7    256  473
 17         7    289  480
 18         7    324  487
 19         7    361  494
 20         7    400  501
 21         6    441  507
 22         5    484  512
 23         4    529  516
 24         4    576  520

Check out the updated Shiny App to let the App do the work for you.

To leave a comment for the author, please follow the link and comment on their blog: DataScience+.

R-bloggers.com offers daily e-mail updates about R news and tutorials on topics such as: Data science, Big Data, R jobs, visualization (ggplot2, Boxplots, maps, animation), programming (RStudio, Sweave, LaTeX, SQL, Eclipse, git, hadoop, Web Scraping) statistics (regression, PCA, time series, trading) and more...

A short video tutorial on my R package cricketr

$
0
0

Building Shiny apps – an interactive tutorial

$
0
0

(This article was first published on Dean Attali's R Blog, and kindly contributed to R-bloggers)

This tutorial was originally developed for the STAT545 course at UBC, but I decided to publish it shortly afterwards so that more people can benefit from it

Shiny is a package from RStudio that can be used to build interactive web pages with R. While that may sound scary because of the words “web pages”, it’s geared to R users who have 0 experience with web development, and you do not need to know any HTML/CSS/JavaScript.

You can do quite a lot with Shiny: think of it as an easy way to make an interactive web page, and that web page can seamlessly interact with R and display R objects (plots, tables, of anything else you do in R). To get a sense of the wide range of things you can do with Shiny, you can visit ShowMeShiny.com, which is a gallery of user-submitted Shiny apps.

This tutorial is a hands-on activity complement to a set of presentation slides for learning how to build Shiny apps. In this activity, we’ll walk through all the steps of building a Shiny app using a dataset that lets you explore the products available at the BC Liquor Store. The final version of the app, including a few extra features that are left as exercises for the reader, can be seen here. Any activity deemed as an exercise throughout this tutorial is not mandatory for building our app, but they are good for getting more practice with Shiny.

As an added tutorial, I highly recommend the official Shiny tutorial. RStudio also provides a handy cheatsheet to remember all the little details after you already learned the basics.

Exercise: Visit ShowMeShiny.com and click through some of the showcased apps. Get a feel for the wide range of things you can do with Shiny.

Table of contents

Before we begin

You’ll need to have the shiny package, so install it.

1 install.packages("shiny")

To ensure you successfully installed Shiny, try running one of the demo apps.

1 library(shiny)
2 runExample("01_hello")

If the example app is running, press Escape to close the app, and you are ready to build your first Shiny app!

Shiny app basics

Every Shiny app is composed of a two parts: a web page that shows the app to the user, and a computer that powers the app. The computer that runs the app can either be your own laptop (such as when you’re running an app from RStudio) or a server somewhere else. You, as the Shiny app developer, need to write these two parts (you’re not going to write a computer, but rather the code that powers the app). In Shiny terminology, they are called UI (user interface) and server. UI is just a web document that the user gets to see, it’s HTML that you write using Shiny’s functions. Server is responsible for the logic of the app; it’s the set of instructions that tell the web page what to show when the user interacts with the page.

Create an empty Shiny app

All Shiny apps follow the same template:

1 library(shiny)
2 ui <- fluidPage()
3 server <- function(input, output, session) {}
4 shinyApp(ui = ui, server = server)

This template is by itself a working minimal Shiny app that doesn’t do much. It initializes an empty UI and an empty server, and runs an app using these empty parts. Copy this template into a new file named app.R in a new folder. It is very important that the name of the file is app.R, otherwise it would not be recognized as a Shiny app. It is also very important that you place this app in its own folder, and not in a folder that already has other R scripts or files, unless those other files are used by your app.

After saving the file, RStudio should recognize that this is a Shiny app, and you should see the usual Run button at the top change to Run App.

Shiny Run App

If you don’t see the Run App button, it means you either have a very old version of RStudio, don’t have Shiny installed, or didn’t follow the file naming conventions.

Click the Run App button, and now your app should run. You won’t see much because it’s an empty app, but you should see that the console has some text printed in the form of Listening on http://127.0.0.1:5274 and that a little stop sign appeared at the top of the console. You’ll also notice that you can’t run any commands in the console. This is because R is busy–your R session is currently powering a Shiny app and listening for user interaction (which won’t happen because the app has nothing in it yet).

Click the stop button to stop the app, or press the Escape key.

Shiny Stop App

You may have noticed that when you click the Run App button, all it’s doing is just running the function shiny::runApp() in the console. You can run that command instead of clicking the button if you prefer.

Exercise: Try running the empty app using the runApp() function instead of using the Run App button.

Alternate way to create app template: using RStudio

FYI: You can also create a new Shiny app using RStudio’s menu by selecting File > New Project > New Directory > Shiny Web Application. If you do this, RStudio will create a new folder and initialize a simple Shiny app in it. However, this Shiny app will not have an app.R file and instead will have two files: ui.R and server.R. This is another way to define Shiny apps, with one file for the UI and one file for the server code. This is the preferable way to write Shiny apps when the app is complex and involves more code, but in this tutorial we’ll stick to the simple single file. If you want to break up your app into these two files, you simple put all code that is assigned to the ui variable in ui.R and all the code assigned to the server function in server.R. When RStudio sees these two files in the same folder, it will know you’re writing a Shiny app.

Exercise: Try creating a new Shiny app using RStudio’s menu. Make sure that app runs. Next, try making a new Shiny app by manually creating the two files ui.R and server.R. Rememeber that they have to be in the same folder. Also remember to put them in a new, isolated folder.

Load the dataset

The dataset we’ll be using contains information about all the products sold by BC Liquor Store and is provided by OpenDataBC. They provide a direct link to download a csv version of the data, and this data has the rare quality that it is immediately clean and useful. You can view the raw data they provide, but I have taken a few steps to simplify the dataset to make it more useful for our app. I removed some columns, renamed other columns, and dropped a few rare factor levels.

The processed dataset we’ll be using in this app is available here – download it now. Put this file in the same folder that has your Shiny app.

Add a line in your app to load the data into a variable called bcl. It should look something like this

1 bcl <- read.csv("bcl-data.csv", stringsAsFactors = FALSE)

Place this line in your app as the second line, just after library(shiny). Make sure the file path and file name are correct, otherwise your app won’t run. Try to run the app to make sure the file can be loaded without errors.

If you want to verify that the app can successfully read the data, you can add a print() statement inside the server. This won’t make anything happen in your Shiny app, but you will see a summary of the dataset printed in the console, which should let you know that the dataset was indeed loaded correctly. Replace the server function with the following:

1 server <- function(input, output, session) {
2   print(str(bcl))
3 }

In case you’re curious, the code I used to process the raw data into the data we’ll be using is available as a gist.

Exercise: Load the data file into R and get a feel for what’s in it. How big is it, what variables are there, what are the normal price ranges, etc.

Build the UI

Let’s start populating our app with some elements visually. This is usually the first thing you do when writing a Shiny app – add elements to the UI.

Add plain text to the UI

You can place R strings inside fluidPage() to render text.

1 fluidPage("BC Liquor Store", "prices")

Replace the line in your app that assigns an empty fluidPage() into ui with the one above, and run the app.

The entire UI will be built by passing comma-separated arguments into the fluidPage() function. By passing regular text, the web page will just render boring unformatted text.

Exercise: Add several more strings to fluidPage() and run the app. Nothing too exciting is happening yet, but you should just see all the text appear in one contiguous block.

Add formatted text and other HTML elements

If we want our text to be formatted nicer, Shiny has many functions that are wrappers around HTML tags that format text. We can use the h1() function for a top-level header (<h1> in HTML), h2() for a secondary header (<h2> in HTML), strong() to make text bold (<strong> in HTML), em() to make text italicized (<em> in HTML), and many more.

There are also functions that are wrappers to other HTML tags, such as br() for a line break, img() for an image, a() for a hyperlink, and others.

All of these functions are actually just wrappers to HTML tags with the equivalent name. You can add any arbitrary HTML tag using the tags object, which you can learn more about by reading the help file on tags.

Just as a demonstration, try replacing the fluidPage() function in your UI with

1 fluidPage(
2   h1("My app"),
3   "BC",
4   "Liquor",
5   br(),
6   "Store",
7   strong("prices")
8 )

Run the app with this code as the UI. Notice the formatting of the text and understand why it is rendered that way.

For people who know basic HTML: any named argument you pass to an HTML function becomes an attribute of the HTML element, and any unnamed argument will be a child of the element. That means that you can, for example, create blue text with div("this is blue", style = "color: blue;").

Exercise: Experiment with different HTML-wrapper functions inside fluidPage(). Run the fluidPage(...) function in the console and see the HTML that it creates.

Add a title

We could add a title to the app with h1(), but Shiny also has a special function titlePanel(). Using titlePanel() not only adds a visible big title-like text to the top of the page, but it also sets the “official” title of the web page. This means that when you look at the name of the tab in the browser, you’ll see this title.

Overwrite the fluidPage() that you experimented with so far, and replace it with the simple one below, that simply has a title and nothing else.

1 fluidPage(
2   titlePanel("BC Liquor Store prices")
3 )

Exercise: Look at the documentation for the titlePanel() function and notice it has another argument. Use that argument and see if you can see what it does.

Add a layout

You may have noticed that so far, by just adding text and HTML tags, everything is unstructured and the elements simply stack up one below the other in one column. We’ll use sidebarLayout() to add a simple structure. It provides a simple two-column layout with a smaller sidebar and a larger main panel. We’ll build our app such that all the inputs that the user can manipulate will be in the sidebar, and the results will be shown in the main panel on the right.

Add the following code after the titlePanel()

1 sidebarLayout(
2   sidebarPanel("our inputs will go here"),
3   mainPanel("the results will go here")
4 )

Remember that all the arguments inside fluidPage() need to be separated by commas.

So far our complete app looks like this (hopefully this isn’t a surprise to you)

 1 library(shiny)
 2 bcl <- read.csv("bcl-data.csv", stringsAsFactors = FALSE)
 3 
 4 ui <- fluidPage(
 5   titlePanel("BC Liquor Store prices"),
 6   sidebarLayout(
 7     sidebarPanel("our inputs will go here"),
 8     mainPanel("the results will go here")
 9   )
10 )
11 
12 server <- function(input, output, session) {}
13 
14 shinyApp(ui = ui, server = server)

Shiny layout

If you want to be a lot more flexible with the design, you can have much more fine control over where things go by using a grid layout. We won’t cover that here, but if you’re interested, look at the documentation for ?column and ?fluidRow.

Exercise: Add some UI into each of the two panels (sidebar panel and main panel) and see how your app now has two columns.

All UI functions are simply HTML wrappers

This was already mentioned, but it’s important to remember: the enire UI is just HTML, and Shiny simply gives you easy tools to write it without having to know HTML. To convince yourself of this, look at the output when printing the contents of the ui variable.

1 print(ui)
## <div class="container-fluid">
##   <h2>BC Liquor Store prices</h2>
##   <div class="row">
##     <div class="col-sm-4">
##       <form class="well">our inputs will go here</form>
##     </div>
##     <div class="col-sm-8">the results will go here</div>
##   </div>
## </div>

This should make you appreciate Shiny for not making you write horrendous HTML by hand.

Add inputs

Inputs are what gives users a way to interact with a Shiny app. Shiny provides many input functions to support many kinds of interactions that the user could have with an app. For example, textInput() is used to let the user enter text, numericInput() lets the user select a number, dateInput() is for selecting a date, selectInput() is for creating a select box (aka a dropdown menu).

Shiny inputs

All input functions have the same first two arguments: inputId and label. The inputId will be the name that Shiny will use to refer to this input when you want to retrieve its current value. It is important to note that every input must have a unique inputId. If you give more than one input the same id, Shiny will unfortunately not give you an explicit error, but your app won’t work correctly. The label argument specifies the text in the display label that goes along with the input widget. Every input can also have multiple other arguments specific to that input type. The only way to find out what arguments you can use with a specific input function is to look at its help file.

Exercise: Read the documentation of ?numericInput and try adding a numeric input to the UI. Experiment with the different arguments. Run the app and see how you can interact with this input. Then try different inputs types.

Input for price

The first input we want to have is for specifying a price range (minimum and maximum price). The most sensible types of input for this are either numericInput() or sliderInput() since they are both used for selecting numbers. If we use numericInput(), we’d have to use two inputs, one for the minimum value and one for the maximum. Looking at the documentation for sliderInput(), you’ll see that by supplying a vector of length two as the value argument, it can be used to specify a range rather than a single number. This sounds like what we want in this case, so we’ll use sliderInput().

To create a slider input, a maximum value needs to be provided. We could use the maximum price in the dataset, which is $30,250, but I doubt I’d ever buy something that expensive. I think $100 is a more reasonable max price for me, and about 85% of the products in this dataset are below $100, so let’s use that as our max.

By looking at the documentation for the slider input function, the following piece of code can be constructed.

1 sliderInput("priceInput", "Price", min = 0, max = 100,
2             value = c(25, 40), pre = "$")

Place the code for the slider input inside sidebarPanel() (replace the text we wrote earlier with this input).

Input for product type

Usually when going to the liquor store you know whether you’re looking for beer or wine, and you don’t want to waste your time in the wrong section. The same is true in our app, we should be able to choose what type of product we want.

For this we want some kind of a text input. But allowing the user to enter text freely isn’t the right solution because we want to restrict the user to only a few choices. We could either use radio buttons or a select box for our purpose. Let’s use radio buttons for now since there are only a few options, so take a look at the documentation for radioButtons() and come up with a reasonable input function code. It should look like this:

1 radioButtons("typeInput", "Product type",
2             choices = c("BEER", "REFRESHMENT", "SPIRITS", "WINE"),
3             selected = "WINE")

Add this input code inside sidebarPanel(), after the previous input (separate them with a comma).

If you look at that input function and think “what if there were 100 types, listing htem by hand would not be fun, there’s got to be a better way!”, then you’re right. This is where uiOutput() comes in handy, but we’ll talk about that later.

Input for country

Sometimes I like to feel fancy and only look for wines imported from France. We should add one last input, to select a country. The most appropriate input type in this case is probably the select box. Look at the documentation for selectInput() and create an input function. For now let’s only have CANADA, FRANCE, ITALY as options, and later we’ll see how to include all countries.

1 selectInput("countryInput", "Country",
2             choices = c("CANADA", "FRANCE", "ITALY"))

Add this function as well to your app. If you followed along, your entire app should have this code:

 1 library(shiny)
 2 bcl <- read.csv("bcl-data.csv", stringsAsFactors = FALSE)
 3 
 4 ui <- fluidPage(
 5   titlePanel("BC Liquor Store prices"),
 6   sidebarLayout(
 7     sidebarPanel(
 8       sliderInput("priceInput", "Price", 0, 100, c(25, 40), pre = "$"),
 9       radioButtons("typeInput", "Product type",
10                   choices = c("BEER", "REFRESHMENT", "SPIRITS", "WINE"),
11                   selected = "WINE"),
12       selectInput("countryInput", "Country",
13                   choices = c("CANADA", "FRANCE", "ITALY"))
14     ),
15     mainPanel("the results will go here")
16   )
17 )
18 
19 server <- function(input, output, session) {}
20 
21 shinyApp(ui = ui, server = server)

Shiny add inputs

Add placeholders for outputs

After creating all the inputs, we should add elements to the UI to display the outputs. Outputs can be any object that R creates and that we want to display in our app – such as a plot, a table, or text. We’re still only building the UI, so at this point we can only add placeholders for the outputs that will determine where an output will be and what its ID is, but it won’t actually show anything. Each output needs to be constructed in the server code later.

Shiny provides several output functions, one for each type of output. Similarly to the input functions, all the ouput functions have a outputId argument that is used to identify each output, and this argument must be unique for each output.

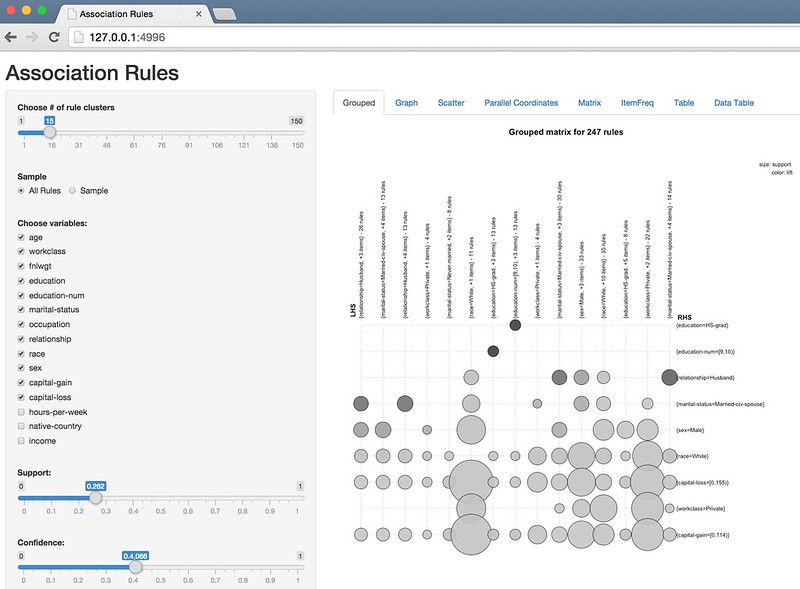
Output for a plot of the results

At the top of the main panel we’ll have a plot showing some visualization of the results. Since we want a plot, the function we use is plotOutput().

Add the following code into the mainPanel() (replace the existing text):

1 plotOutput("coolplot")

This will add a placeholder in the UI for a plot named coolplot.

Exercise: To remind yourself that we are still merely constructing HTML and not creating actual plots yet, run the above plotOutput() function in the console to see that all it does is create some HTML.

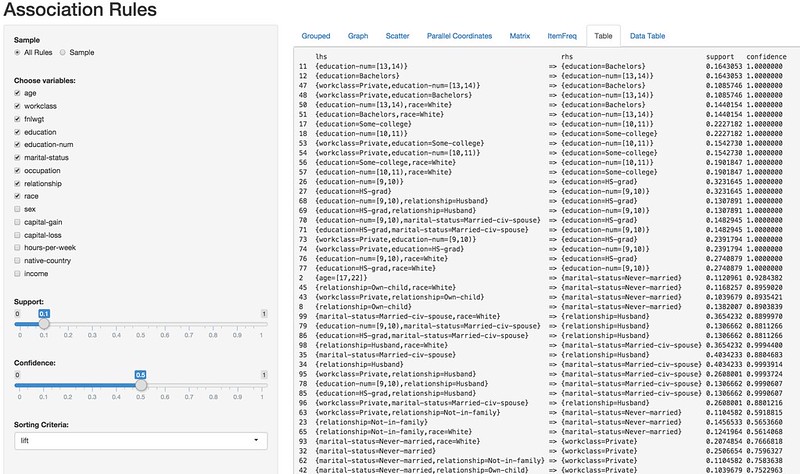
Output for a table summary of the results

Below the plot, we will have a table that shows all the results. To get a table, we use the tableOutput() function.

Here is a simple way to create a UI element that will hold a table output:

1 tableOutput("results")

Add this output to the mainPanel() as well. Maybe add a couple br() in between the two outputs, just as a space buffer so that they aren’t too close to each other.

Checkpoint: what our app looks like after implementing the UI

If you’ve followed along, your app should now have this code:

 1 library(shiny)
 2 bcl <- read.csv("bcl-data.csv", stringsAsFactors = FALSE)
 3 
 4 ui <- fluidPage(
 5   titlePanel("BC Liquor Store prices"),
 6   sidebarLayout(
 7     sidebarPanel(
 8       sliderInput("priceInput", "Price", 0, 100, c(25, 40), pre = "$"),
 9       radioButtons("typeInput", "Product type",
10                   choices = c("BEER", "REFRESHMENT", "SPIRITS", "WINE"),
11                   selected = "WINE"),
12       selectInput("countryInput", "Country",
13                   choices = c("CANADA", "FRANCE", "ITALY"))
14     ),
15     mainPanel(
16       plotOutput("coolplot"),
17       br(), br(),
18       tableOutput("results")
19     )
20   )
21 )
22 
23 server <- function(input, output, session) {}
24 
25 shinyApp(ui = ui, server = server)

Implement server logic to create outputs

So far we only wrote code inside that was assigned to the ui variable (or code that was written in ui.R). That’s usually the easier part of a Shiny app. Now we have to write the server function, which will be responsible for listening to changes to the inputs and creating outputs to show in the app.

Building an output

Recall that we created two output placeholders: coolplot (a plot) and results (a table). We need to write code in R that will tell Shiny what kind of plot or table to display. There are three rules to build an output in Shiny.

  1. Save the output object into the output list (remember the app template – every server function has an output argument)
  2. Build the object with a render* function, where * is the type of output
  3. Access input values using the input list (every server function has an input argument)

The third rule is only required if you want your output to depend on some input, so let’s first see how to build a very basic output using only the first two rules. We’ll create a plot and send it to the coolplot output.

1 output$coolplot <- renderPlot({
2   plot(rnorm(100))
3 })

This simple code shows the first two rules: we’re creating a plot inside the renderPlot() function, and assigning it to coolplot in the output list. Remember that every output creatd in the UI must have a unique ID, now we see why. In order to attach an R object to an output with ID x, we assign the R object to output$x.

Since coolplot was defined as a plotOutput, we must use the renderPlot function, and we must create a plot inside the renderPlot function.

If you add the code above inside the server function, you should see a plot with 100 random points in the app.

Exercise: The code inside renderPlot() doesn’t have to be only one line, it can be as long as you’d like as long as it returns a plot. Try making a more complex plot using ggplot2. The plot doesn’t have to use our dataset, it could be anything, just to make sure you can use renderPlot().

Making an output react to an input

Now we’ll take the plot one step further. Instead of always plotting the same plot (100 random numbers), let’s use the minimum price selected as the number of points to show. It doesn’t make too much sense, but it’s just to learn how to make an output depend on an input.

1 output$coolplot <- renderPlot({
2   plot(rnorm(input$priceInput[1]))
3 })

Replace the previous code in your server function with this code, and run the app. Whenever you choose a new minimum price range, the plot will update with a new number of points. Notice that the only thing different in the code is that instead of using the number 100 we are using input$priceInput[1].

What does this mean? Just like the variable output contains a list of all the outputs (and we need to assign code into them), the variable input contains a list of all the inputs that are defined in the UI. input$priceInput return a vector of length 2 containing the miminimum and maximum price. Whenever the user manipulates the slider in the app, these values are updated, and whatever code relies on it gets re-evaluated. This is a concept known as reactivity.

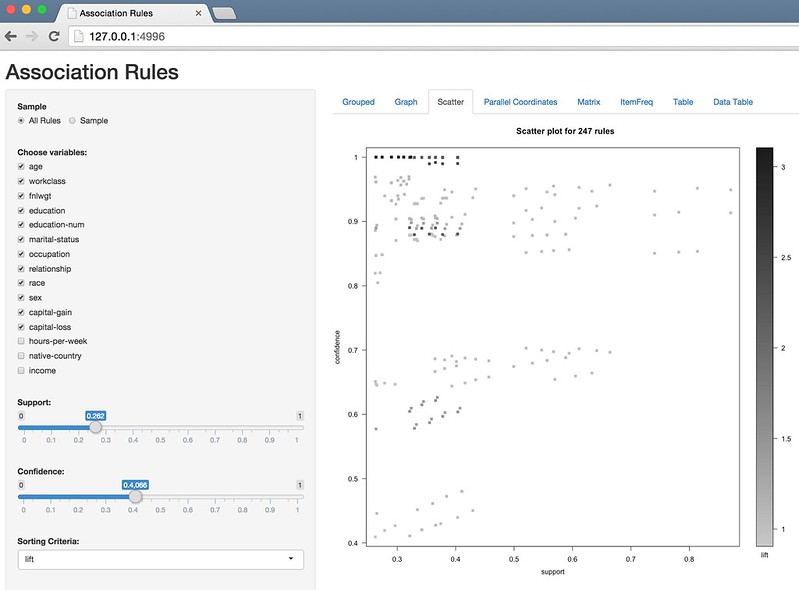
Building the plot output

Now we have all the knowledge required to build a plot visualizing some aspect of the data. We’ll create a simple histogram of the alcohol content of the products.

First we need to make sure ggplot2 is loaded, so add a library(ggplot2) at the top.

Next we’ll return a histogram of alcohol content from renderPlot(). Let’s start with just a histogram of the whole data, unfiltered.

1 output$coolplot <- renderPlot({
2   ggplot(bcl, aes(Alcohol_Content)) +
3     geom_histogram()
4 })

If you run the app with this code inside your server, you sohuld see a histogram in the app. But if you change the input values, nothing happens yet, so the next step is to actually filter the dataset based on the inputs.

Recall that we have 3 inputs: priceInput, typeInput, and countryInput. We can filter the data based on the values of these three inputs. We’ll use dplyr functions to filter the data, so be sure to include dplyr at the top. Then we’ll plot the filtered data instead of the original data.

 1 output$coolplot <- renderPlot({
 2   filtered <-
 3     bcl %>%
 4     filter(Price >= input$priceInput[1],
 5            Price <= input$priceInput[2],
 6            Type == input$typeInput,
 7            Country == input$countryInput
 8     )
 9   ggplot(filtered, aes(Alcohol_Content)) +
10     geom_histogram()
11 })

Place this code in your server function and run the app. If you change any input, you should see the histogram update. The way I know the histogram is correct is by noticing that the alcohol content is about 5% when I selecte beer, 40% for spirits, and 13% for wine. That sounds right.

Read this code and understand it. You’ve successfully created an interactive app – the plot is changing according to the user’s selection.

To make sure we’re on the same page, here is what your code should look like at this point:

 1 library(shiny)
 2 library(ggplot2)
 3 library(dplyr)
 4 
 5 bcl <- read.csv("bcl-data.csv", stringsAsFactors = FALSE)
 6 
 7 ui <- fluidPage(
 8   titlePanel("BC Liquor Store prices"),
 9   sidebarLayout(
10     sidebarPanel(
11       sliderInput("priceInput", "Price", 0, 100, c(25, 40), pre = "$"),
12       radioButtons("typeInput", "Product type",
13                   choices = c("BEER", "REFRESHMENT", "SPIRITS", "WINE"),
14                   selected = "WINE"),
15       selectInput("countryInput", "Country",
16                   choices = c("CANADA", "FRANCE", "ITALY"))
17     ),
18     mainPanel(
19       plotOutput("coolplot"),
20       br(), br(),
21       tableOutput("results")
22     )
23   )
24 )
25 
26 server <- function(input, output, session) {
27   output$coolplot <- renderPlot({
28     filtered <-
29       bcl %>%
30       filter(Price >= input$priceInput[1],
31              Price <= input$priceInput[2],
32              Type == input$typeInput,
33              Country == input$countryInput
34       )
35     ggplot(filtered, aes(Alcohol_Content)) +
36       geom_histogram()
37   })
38 }
39 
40 shinyApp(ui = ui, server = server)

Shiny add plot

Exercise: The current plot doesn’t look very nice, you could enhance the plot and make it much more pleasant to look at.

Building the table output

Building the next output should be much easier now that we’ve done it once. The other output we have was called results (as defined in the UI) and should be a table of all the products that match the filters. Since it’s a table output, we should use the renderTable() function. We’ll do the exact same filtering on the data, and then simply return the data as a data.frame. Shiny will know that it needs to display it as a table because it’s defined as a tableOutput.

The code for creating the table output should make sense to you without too much explanation:

 1 output$results <- renderTable({
 2   filtered <-
 3     bcl %>%
 4     filter(Price >= input$priceInput[1],
 5            Price <= input$priceInput[2],
 6            Type == input$typeInput,
 7            Country == input$countryInput
 8     )
 9   filtered
10 })

Add this code to your server. Don’t overwrite the previous definition of output$coolplot, just add this code before or after that, but inside the server function. Run your app, and be amazed! You can now see a table showing all the products at the BC Liquor Store that match your criteria.

Exercise: Add a new output. Either a new plot, a new table, or some piece of text that changes based on the inputs. For example, you could add a text output (textOutput() in the UI, renderText() in the server) that says how many results were found. If you choose to do this, I recommend first adding the output to the UI, then building the output in the server with static text to make sure you have the syntax correct. Only once you can see the text output in your app you should make it reflect the inputs. Protip: since textOutput() is written in the UI, you can wrap it in other UI functions. For example, h2(textOutput(...)) will result in larger text.

Reactivity 101

Shiny uses a concept called reactive programming. This is what enables your outputs to react to changes in inputs. Reactivity in Shiny is complex, but as an extreme oversimplification, it means that when the value of a variable x changes, then anything that relies on x gets re-evaluated. Notice how this is very different from what you are used to in R. Consider the following code:

1 x <- 5
2 y <- x + 1
3 x <- 10

What is the value of y? It’s 6. But in reactive programming, if x and y are reactive variables, then the value of y would be 11. This is a very powerful technique that is very useful for creating the responsiveness of Shiny apps, but it might be a bit weird at first because it’s a very different concept from what we’re used to.

Only reactive objects variables behave this way, and in Shiny all inputs are automatically reactive. That’s why you can always use input$x and know that whatever output you’re creating will use the updated value of x. You can use the reactive({}) function to define a reactive variable, or the observe({}) function to access a reactive variable.

One very important thing to remember about reactive variable is that they can only be used inside reactive contexts. Any render* function is a reactive context, so you can always use input$x or any other reactive variable inside render functions. reactive() and observe() are also reactive contexts.

To prove this point, try printing the value of the price input in the server function by simply adding print(input$priceInput) to the server. When I run the app with that print function, I get the following error:

Operation not allowed without an active reactive context. (You tried to do something that can only be done from inside a reactive expression or observer.)

It’s pretty clear about what the error is. Now try wrapping the print statement inside an observe({}), and this time it would work.

Using reactive variables to reduce code duplication

You may have noticed that we have the exact same code filtering the dataset in two places, once in each render function. We can solve that problem by defining a reactive variable that will hold the filtered dataset, and use that variable in the render functions.

The first step would be to create the reactive variable. The following code should be added to the server function.

1 filtered <- reactive({
2   bcl %>%
3     filter(Price >= input$priceInput[1],
4            Price <= input$priceInput[2],
5            Type == input$typeInput,
6            Country == input$countryInput
7     )
8 })

The variable filtered is being defined exactly like before, except the body is wrapped by a reactive({}), and it’s defined in the server function instead of inside the individual render functions.

Reactive expressions defined with the reactive() function are treated like functions, so to access the value of a reactive expression, you to get the value of the dataset at any time you would use filtered() (notice that there are brackets at the end, as if it’s a function). Now that we have our reactive variable, we can use it in the output render functions. Try it yourself, and when you think you’re done, check the code below. This is how your server function should look like now.

 1 server <- function(input, output, session) {
 2   filtered <- reactive({
 3     bcl %>%
 4       filter(Price >= input$priceInput[1],
 5              Price <= input$priceInput[2],
 6              Type == input$typeInput,
 7              Country == input$countryInput
 8       )
 9   })
10   
11   output$coolplot <- renderPlot({
12     ggplot(filtered(), aes(Alcohol_Content)) +
13       geom_histogram()
14   })
15 
16   output$results <- renderTable({
17     filtered()
18   })
19 }

You may be wondering how this works. Shiny creates a dependency tree with all the reactive expressions to know what value depends on what other value. For example, when the price input changes, Shiny looks at what values depend on price, and sees that filtered is a reactive expression that depends on the price input, so it re-evaluates filtered. Then, because filtered is changed, Shiny now looks to see what expressions depend on filtered, and it finds that the two render functions use filtered. So Shiny re-executes the two render functions as well.

If you want to understand reactivity better, you can read about it on Shiny’s site.

Exercise: Create a reactive variable that calculates the difference between the maximum and minimum price set by the user, and print that value to the console. This won’t be useful for the app, but is just an exercise to practice with reactive expressions. Hint: use the reactive({}) function to define the value, and remember that you must be inside an observe({}) in order to print it.

Using uiOutput() to create UI elements dynamically

One of the output functions you can add in the UI is uiOutput(). According to the naming convention (eg. plotOutput() is an output to render a plot), this is an output used to render an input. This may sound a bit confusing, but it’s actually very useful. It’s used to create inputs from the server, or in other words – you can create inputs dynamically. Any input that you normally create in the UI is created when the app starts, and it cannot be changed. But what if one of your inputs depends on another input? In that case, you want to be able to create an input dynamically, in the server, and you would use uiOutput(). uiOutput() can be used to create any UI element, but it’s most often used to create input UI elements. The same rules regarding building outputs apply, which means the output (which is a UI element in this case) is created with the function renderUI().

Basic example

As a very basic example, consider this app:

 1 library(shiny)
 2 ui <- fluidPage(
 3   numericInput("num", "Maximum slider value", 5),
 4   uiOutput("slider")
 5 )
 6 
 7 server <- function(input, output, session) {
 8   output$slider <- renderUI({
 9     sliderInput("slider", "Slider", min = 0,
10                 max = input$num, value = 0)
11   })
12 }
13 
14 shinyApp(ui = ui, server = server)

If you run that tiny app, you will see that whenever you change the value of the numeric input, the slider input is re-generated. This behaviour can come in handy often.

Use uiOutput() in our app to populate the countries

We can use this concept in our app to populate the choices for the country selector. The country selector currently only holds 3 values that we manually entered, but instead we could render the country selector in the server and use the data to determine what countries it can have.

First we need to replace the selectInput("countryInput", ...) in the UI with

1 uiOutput("countryOutput")

Then we need to create the output (which will create a UI element – yeah, it can be a bit confusing at first), so add the following code to the server function:

1 output$countryOutput <- renderUI({
2   selectInput("countryInput", "Country",
3               sort(unique(bcl$Country)),
4               selected = "CANADA")
5 })

Now if you run the app, you should be able to see all the countries that BC Liquor stores import from.

Errors showing up and quickly disappearing

You might notice that when you first run the app, each of the two outputs are throwing an error message, but the error message goes away after a second. The problem is that when the app initializes, filtered is trying to access the country input, but the country input hasn’t been created yet. After Shiny finishes loading fully and the country input is generated, filtered tries accessing it again, this time it’s successful, and the error goes away.

Once we understand why the error is happening, fixing it is simple. Inside the filtered reactive function, we should check if the country input exists, and if not then just return NULL.

 1 filtered <- reactive({
 2   if (is.null(input$countryInput)) {
 3     return(NULL)
 4   }    
 5   
 6   bcl %>%
 7     filter(Price >= input$priceInput[1],
 8            Price <= input$priceInput[2],
 9            Type == input$typeInput,
10            Country == input$countryInput
11     )
12 })

Now when the render function tries to access the data, they will get a NULL value before the app is fully loaded. You will still get an error, because the ggplot function will not work with a NULL dataset, so we also need to make a similar check in the renderPlot() function. Only once the data is loaded, we can try to plot.

1 output$coolplot <- renderPlot({
2   if (is.null(filtered())) {
3     return()
4   }
5   ggplot(filtered(), aes(Alcohol_Content)) +
6     geom_histogram()
7 })

The renderTable() function doesn’t need this fix applied because Shiny doesn’t have a problem rendering a NULL table.

Exercise: Change the product type radio buttons to get generated in the server with the values from the dataset, instead of being created in the UI with the values entered manually. If you’re feeling confident, try adding an input for “subtype” that will get re-generated every time a new type is chosen, and will be populated with all the subtype options available for the currently selected type (for example, if WINE is selected, then the subtype are white wine, red wine, etc.).

Final Shiny app code

In case you got lost somewhere, here is the final code. The app is now functional, but there are plenty of features you can add to make it better.

 1 library(shiny)
 2 library(ggplot2)
 3 library(dplyr)
 4 
 5 bcl <- read.csv("bcl-data.csv", stringsAsFactors = FALSE)
 6 
 7 ui <- fluidPage(
 8   titlePanel("BC Liquor Store prices"),
 9   sidebarLayout(
10     sidebarPanel(
11       sliderInput("priceInput", "Price", 0, 100, c(25, 40), pre = "$"),
12       radioButtons("typeInput", "Product type",
13                   choices = c("BEER", "REFRESHMENT", "SPIRITS", "WINE"),
14                   selected = "WINE"),
15       uiOutput("countryOutput")
16     ),
17     mainPanel(
18       plotOutput("coolplot"),
19       br(), br(),
20       tableOutput("results")
21     )
22   )
23 )
24 
25 server <- function(input, output, session) {
26   output$countryOutput <- renderUI({
27     selectInput("countryInput", "Country",
28                 sort(unique(bcl$Country)),
29                 selected = "CANADA")
30   })  
31   
32   filtered <- reactive({
33     if (is.null(input$countryInput)) {
34       return(NULL)
35     }    
36     
37     bcl %>%
38       filter(Price >= input$priceInput[1],
39              Price <= input$priceInput[2],
40              Type == input$typeInput,
41              Country == input$countryInput
42       )
43   })
44   
45   output$coolplot <- renderPlot({
46     if (is.null(filtered())) {
47       return()
48     }
49     ggplot(filtered(), aes(Alcohol_Content)) +
50       geom_histogram()
51   })
52 
53   output$results <- renderTable({
54     filtered()
55   })
56 }
57 
58 shinyApp(ui = ui, server = server)

Share your app with the world

Remember how every single app is a web page powered by an R session on a computer? So far, you’ve been running Shiny locally, which means your computer was used to power the app. It also means that the app was not accessible to anyone on the internet. If you want to share your app with the world, you need to host it somewhere.

Host on shinyapps.io

RStudio provides a service called shinyapps.io which lets you host your apps for free. It is integrated seamlessly into RStudio so that you can publish your apps with the click of a button, and it has a free version. The free version allows a certain number of apps per user and a certain number of activity on each app, but it should be good enough for most of you. It also lets you see some basic stats about usage of your app.

Hosting your app on shinyapps.io is the easy and recommended way of getting your app online. Go to www.shinyapps.io and sign up for an account. When you’re ready to publish your app, click on the “Publish Application” button in RStudio and follow their instructions. You might be asked to install a couple packages if it’s your first time.

Shiny publish

After a successful deployment to shinyapps.io, you will be redirected to your app in the browser. You can use that URL to show off to your family what a cool app you wrote.

Host on a Shiny Server

The other option for hosting your app is on your own private Shiny server. Shiny Server is also a product by RStudio that lets you host apps on your own server. This means that instead of RStudio hosting the app for you, you have it on your own private server. This means you have a lot more freedom and flexibility, but it also means you need to have a server and be comfortable administering a server. I currently host all my apps on my own Shiny server just because I like having the extra control, but when I first learned about Shiny I used shinyapps.io for several months.

If you’re feeling adventurous and want to host your own server, you can follow my tutorial for hosting a Shiny server.

More Shiny features to check out

Shiny is extremely powerful and has lots of features that we haven’t covered. Here’s a sneak peek of just a few other common Shiny features that are not too advanced.

Shiny in Rmarkdown

You can include Shiny inputs and outputs in an Rmarkdown document! This means that your Rmakdown document can be interactive. Learn more here. Here’s a simple example of how to include interactive Shiny elements in an Rmarkdown.

---
output: html_document
runtime: shiny
---

```{r echo=FALSE}
sliderInput("num", "Choose a number",
            0, 100, 20)

renderPlot({
    plot(seq(input$num))
})
```

Use conditionalPanel() to conditionally show UI elements

You can use conditionalPanel() to either show or hide a UI element based on a simple condition, such as the value of another input. Learn more with ?conditionalPanel.

 1 library(shiny)
 2 ui <- fluidPage(
 3   numericInput("num", "Number", 5, 1, 10),
 4   conditionalPanel(
 5     "input.num >=5",
 6     "Hello!"
 7   )
 8 )
 9 server <- function(input, output, session) {}
10 shinyApp(ui = ui, server = server)

Use navbarPage() or tabsetPanel() to have multiple tabs in the UI

If your apps requires more than a single “view”, you can have separate tabs. Learn more with ?navbarPage or ?tabsetPanel.

1 library(shiny)
2 ui <- fluidPage(
3   tabsetPanel(
4     tabPanel("Tab 1", "Hello"),
5     tabPanel("Tab 2", "there!")
6   )
7 )
8 server <- function(input, output, session) {}
9 shinyApp(ui = ui, server = server)

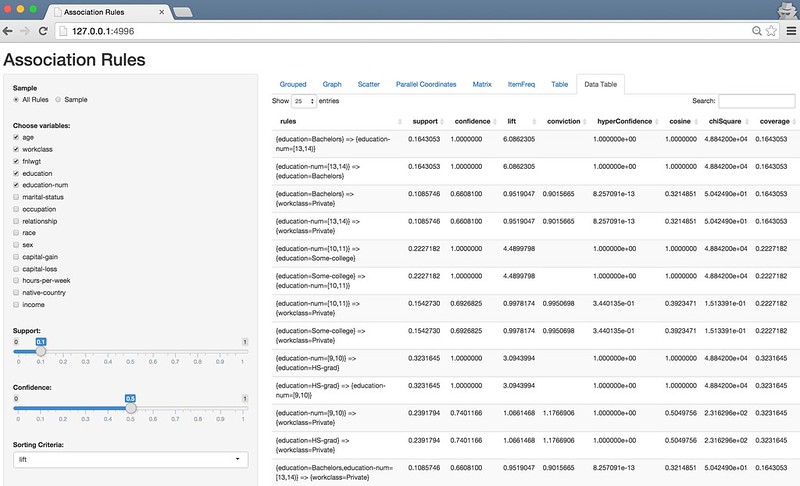
Use DT for beautiful, interactive tables

Whenever you use tableOutput() + renderTable(), the table that Shiny creates is a static and boring-looking table. If you download the DT package, you can replace the default table with a much sleeker table by just using DT::dataTableOutput() + DT::renderDataTable(). It’s worth trying. Learn more on DT’s website.

Use isolate() function to remove a dependency on a reactive variable

When you have multiple reactive variables inside a reactive context, the whole code block will get re-executed whenever any of the reactive variables change because all the variables become dependencies of the code. If you want to suppress this behaviour and cause a reactive variable to not be a dependency, you can wrap the code that uses that variable inside the isolate() function. Any reactive variables that are inside isolate() will not result in the code re-executing when their value is changed. Read more about this behaviour with ?isolate.

Use update*Input() functions to update input values programmatically

Any input function has an equivalent update*Input function that can be used to update any of its parameters.

 1 library(shiny)
 2 ui <- fluidPage(
 3   sliderInput("slider", "Move me", value = 5, 1, 10),
 4   numericInput("num", "Number", value = 5, 1, 10)
 5 )
 6 server <- function(input, output, session) {
 7   observe({
 8     updateNumericInput(session, "num", value = input$slider)
 9   })
10 }
11 shinyApp(ui = ui, server = server)

Scoping rules in Shiny apps

Scoping is very important to understand in Shiny once you want to support more than one user at a time. Since your app can be hosted online, multiple users can use your app simultaneously. If there are any variables (such as datasets or global parameters) that should be shared by all users, then you can safely define them globally. But any variable that should be specific to each user’s session should be not be defined globally.

You can think of the server function as a sandbox for each user. Any code outside of the server function is run once and is shared by all the instances of your Shiny app. Any code inside the server is run once for every user that visits your app. This means that any user-specific variables should be defined inside server. If you look at the code in our BC Liquor Store app, you’ll see that we followed this rule: the raw dataset was loaded outside the server and is therefore available to all users, but the filtered object is constructed inside the server so that every user has their own version of it. If filtered was a global variable, then when one user changes the values in your app, all other users connected to your app would see the change happen.

You can learn more about the scoping rules in Shiny here.

Use global.R to define objects available to both ui.R and server.R

If there are objects that you want to have available to both ui.R and server.R, you can place them in global.R. You can learn more about global.R and other scoping rules here.

Add images

You can add an image to your Shiny app by placing an image under the “www/” folder and using the UI function img(src = "image.png"). Shiny will know to automatically look in the “www/” folder for the image.

Add JavaScript/CSS

If you know JavaScript or CSS you are more than welcome to use some in your app.

 1 library(shiny)
 2 ui <- fluidPage(
 3   tags$head(tags$script("alert('Hello!');")),
 4   tags$head(tags$style("body{ color: blue; }")),
 5   "Hello"
 6 )
 7 server <- function(input, output, session) {
 8   
 9 }
10 shinyApp(ui = ui, server = server)

If you do want to add some JavaScript or use common JavaScript functions in your apps, you might want to check out shinyjs.

Awesome add-on packages to Shiny

Many people have written packages that enhance Shiny in some way or add extra functionality. Here is a list of several popular packages that people often use together with Shiny:

  • shinythemes: Easily alter the appearance of your app
  • shinyjs: Enhance user experience in Shiny apps using JavaScript functions without knowing JavaScript
  • leaflet: Add interactive maps to your apps
  • ggvis: Similar to ggplot2, but the plots are focused on being web-based and are more interactive
  • shinydashboard: Gives you tools to create visual “dashboards”

Resources

Shiny is a very popular package and has lots of resources on the web. Here’s a compiled list of a few resources I recommend, which are all fairly easy to read and understand.

Ideas to improve our app

The app we developed is functional, but there are plenty of improvements that can be made. You can compare the app we developed to my version of this app to get an idea of what a more functional app could include. Here are some suggestions of varying difficulties. Each idea also has a hint, I would recommend only reading the hint if you’re stuck for 10 minutes.

  • Split the app into two separate files: ui.R and server.R.
    • Hint: All the code assigned into the ui variable goes into ui.R and all the code for the server function goes into server.R. You do not need to explicitly call the shinyApp() function.
  • Add an option to sort the results table by price.
    • Hint: Use checkboxInput() to get TRUE/FALSE values from the user.
  • Add an image of the BC Liquor Store to the UI.
    • Hint: Place the image in a folder named www, and use img(src = "imagename.png") to add the image.
  • Share your app with everyone on the internet by deploying to shinyapps.io.
    • Hint: Go to shinyapps.io, register for an account, then click the “Publish App” button in RStudio.
  • Use the DT package to turn the current results table into an interactive table.
    • Hint: Install the DT package, replace tableOutput() with DT::dataTableOutput() and replace renderTable() with DT::renderDataTable().
  • Add parameters to the plot.
    • Hint: You will need to add input functions that will be used as parameters for the plot. You could use shinyjs::colourInput() to let the user decide on the colours of the bars in the plot.
  • The app currently behaves strangely when the user selects filters that return 0 results. For example, try searching for wines from Belgium. There will be an empty plot and empty table generated, and there will be a warning message in the R console. Try to figure out why this warning message is appearing, and how to fix it.
    • Hint: The problem happens because renderPlot() and renderTable() are trying to render an empty dataframe. To fix this issue, the filtered reactive expression should check for the number of rows in the filtered data, and if that number is 0 then return NULL instead of a 0-row dataframe.
  • Place the plot and the table in separate tabs.
    • Hint: Use tabsetPanel() to create an interface with multiple tabs.
  • If you know CSS, add CSS to make your app look nicer.
    • Hint: Add a CSS file under www and use the function includeCSS() to use it in your app.
  • Experiment with packages that add extra features to Shiny, such as shinyjs, leaflet, shinydashboard, shinythemes, ggvis.
    • Hint: Each package is unique and has a different purpose, so you need to read the documentation of each package in order to know what it provides and how to use it.
  • Show the number of results found whenever the filters change. For example, when searching for Italian wines $20-$40, the app would show the text “We found 122 options for you”.
    • Hint: Add a textOutput() to the UI, and in its corresponding renderText() use the number of rows in the filtered() object.
  • Allow the user to download the results table as a .csv file.
    • Hint: Look into the downloadButton() and downloadHandler() functions.
  • When the user wants to see only wines, show a new input that allows the user to filter by sweetness level. Only show this input if wines are selected.
    • Hint: Create a new input function for the sweetness level, and use it in the server code that filters the data. Use conditionalPanel() to conditionally show this new input. The condition argument of conditionalPanel should be something like input.typeInput == "WINE".
  • Allow the user to search for multiple alcohol types simultaneously, instead of being able to choose only wines/beers/etc.
    • Hint: There are two approaches to do this. Either change the typeInput radio buttons into checkboxes (checkboxGroupInput()) since checkboxes support choosing multiple items, or change typeInput into a select box (selectInput()) with the argument multiple = TRUE to support choosing multiple options.
  • If you look at the dataset, you’ll see that each product has a “type” (beer, wine, spirit, or refreshment) and also a “subtype” (red wine, rum, cider, etc.). Add an input for “subtype” that will let the user filter for only a specific subtype of products. Since each type has different subtype options, the choices for subtype should get re-generated every time a new type is chosen. For example, if “wine” is selected, then the subtypes available should be white wine, red wine, etc.
    • Hint: Use uiOutput() to create this input in the server code.
  • Provide a way for the user to show results from all countries (instead of forcing a filter by only one specific country).
    • Hint: There are two ways to approach this. You can either add a value of “All” to the dropdown list of country options, you can include a checkbox for “Filter by country” and only show the dropdown

To leave a comment for the author, please follow the link and comment on their blog: Dean Attali's R Blog.

R-bloggers.com offers daily e-mail updates about R news and tutorials on topics such as: Data science, Big Data, R jobs, visualization (ggplot2, Boxplots, maps, animation), programming (RStudio, Sweave, LaTeX, SQL, Eclipse, git, hadoop, Web Scraping) statistics (regression, PCA, time series, trading) and more...

Just published: Mastering RStudio [Free Sample]

$
0
0

(This article was first published on ThinkToStart » R Tutorials, and kindly contributed to R-bloggers)
After nearly 10 month of work, Max(@nierhoff) and I are really happy to announce that our new book Mastering RStudio – Develop, Communicate, and Collaborate with R was just published.
This book is aimed at R developers and analysts who wish to do R statistical development while taking advantage of RStudio´s functionality to ease development efforts. We assume some R programming experience as well as being comfortable with R´s basic structures and a number of basic functions.

Just Published: Mastering RStudio – Develop, Communicate, and Collaborate with R #rstats
Click To Tweet


RStudio helps you to manage small to large projects by giving you a multi-functional integrated development environment, combined with the power and flexibility of the R programming language.
We will guide you through the whole RStudio IDE and show you its powerful features. After an introduction into the interface, we will learn how to communicate insights with R Markdown in static and interactive ways, build interactive web applications with the Shiny framework to present and share our analysis results and even how to easily collaborate with other people on your projects by using Git and GitHub.
Further, we will show you how you can use R for your organisation with the help of RStudio Server and show you how you create a professional dashboard with R and Shiny.
Max and I hope that you will enjoy this book and we welcome every feedback.
Mastering RStudio

The post Just published: Mastering RStudio [Free Sample] appeared first on ThinkToStart.

To leave a comment for the author, please follow the link and comment on their blog: ThinkToStart » R Tutorials.

R-bloggers.com offers daily e-mail updates about R news and tutorials on topics such as: Data science, Big Data, R jobs, visualization (ggplot2, Boxplots, maps, animation), programming (RStudio, Sweave, LaTeX, SQL, Eclipse, git, hadoop, Web Scraping) statistics (regression, PCA, time series, trading) and more...

My Second (R) Shiny App: Sampling Distributions & CLT

$
0
0

(This article was first published on Quality and Innovation » R, and kindly contributed to R-bloggers)
Image Credit: Doug Buckley of http://hyperactive.to

Image Credit: Doug Buckley of http://hyperactive.to

I was so excited about my initial foray into Shiny development using jennybc‘s amazing googlesheets package that I stayed up half the night last night (again) working on my second Shiny app: a Shiny-fied version of the function I shared in March to do simulations illustrating sampling distributions and the Central Limit Theorem using many different source distributions. (Note that Cauchy doesn’t play by the rules!) Hope this info is useful to all new Shiny developers.

If the app doesn’t work for you, it’s possible that I’ve exhausted my purchased hours at http://shinyapps.io — no idea how much traffic this post might generate. So if that happens to you, please try getting Shiny to work locally, cutting and pasting the code below into server.R and ui.R files, and then launching the simulation from your R console.

Here are some important lessons I learned on my 2nd attempt at Shiny development:

  • Creating a container (rv) for the server-side values that would change as a result of inputs from the UI was important. That container was then available to the portions of my Shiny code that prepared data for the UI, e.g. output$plotSample.
  • Because switch only takes arguments that are 1 character long, using radio buttons in the Shiny UI was really useful: I can map the label on each radio button to one character that will get passed into the data processing on the server side.
  • I was able to modify the CSS for the page by adding a couple lines to mainPanel() in my UI.
  • Although it was not mentally easy (for me) to convert from an R function to a Shiny app when initially presented with the problem, in retrospect, it was indeed straightforward. All I had to do was take the original function, split out the data processing from the presentation (par & hist commands), put the data processing code on the server side and the presentation code on the UI side, change the variable names on the server side so that they had the input$ prefix, and make sure the variable names were consistent between server and UI.
  • I originally tried writing one app.R file, but http://shinyapps.io did not seem to like that, so I put all the code that was not UI into the server side and tried deploying with server.R and ui.R, which worked. I don’t know what I did wrong.
  • If you want to publish to http://shinyapps.io, the directory name that hosts your files must be at least 4 characters long or you will get a “validation error” when you attempt to deployApp().
## Nicole's Second Shiny Demo App
## N. Radziwill, 12/6/2015, http://qualityandinnovation.com
## Used code from http://github.com/homerhanumat as a base
###########################################################
## ui
###########################################################

ui <- fluidPage(
titlePanel('Sampling Distributions and the Central Limit Theorem'),
sidebarPanel(
helpText('Choose your source distribution and number of items, n, in each
sample. 10000 replications will be run when you click "Sample Now".'),
h6(a("Read an article about this simulation at http://www.r-bloggers.com",
href="http://www.r-bloggers.com/sampling-distributions-and-central-limit-theorem-in-r/", target="_blank")),
sliderInput(inputId="n","Sample Size n",value=30,min=5,max=100,step=2),
radioButtons("src.dist", "Distribution type:",
c("Exponential: Param1 = mean, Param2 = not used" = "E",
"Normal: Param1 = mean, Param2 = sd" = "N",
"Uniform: Param1 = min, Param2 = max" = "U",
"Poisson: Param1 = lambda, Param2 = not used" = "P",
"Cauchy: Param1 = location, Param2 = scale" = "C",
"Binomial: Param1 = size, Param2 = success prob" = "B",
"Gamma: Param1 = shape, Param2 = scale" = "G",
"Chi Square: Param1 = df, Param2 = ncp" = "X",
"Student t: Param1 = df, Param2 = not used" = "T")),
numericInput("param1","Parameter 1:",10),
numericInput("param2","Parameter 2:",2),
actionButton("takeSample","Sample Now")
), # end sidebarPanel
mainPanel(
# Use CSS to control the background color of the entire page
tags$head(
tags$style("body {background-color: #9999aa; }")
),
plotOutput("plotSample")
) # end mainPanel
) # end UI

##############################################################
## server
##############################################################

library(shiny)
r <- 10000 # Number of replications... must be ->inf for sampling distribution!

palette(c("#E41A1C", "#377EB8", "#4DAF4A", "#984EA3",
"#FF7F00", "#FFFF33", "#A65628", "#F781BF", "#999999"))

server <- function(input, output) {
set.seed(as.numeric(Sys.time()))

# Create a reactive container for the data structures that the simulation
# will produce. The rv$variables will be available to the sections of your
# server code that prepare output for the UI, e.g. output$plotSample
rv <- reactiveValues(sample = NULL,
all.sums = NULL,
all.means = NULL,
all.vars = NULL)

# Note: We are giving observeEvent all the output connected to the UI actionButton.
# We can refer to input variables from our UI as input$variablename
observeEvent(input$takeSample,
{
my.samples <- switch(input$src.dist,
"E" = matrix(rexp(input$n*r,input$param1),r),
"N" = matrix(rnorm(input$n*r,input$param1,input$param2),r),
"U" = matrix(runif(input$n*r,input$param1,input$param2),r),
"P" = matrix(rpois(input$n*r,input$param1),r),
"C" = matrix(rcauchy(input$n*r,input$param1,input$param2),r),
"B" = matrix(rbinom(input$n*r,input$param1,input$param2),r),
"G" = matrix(rgamma(input$n*r,input$param1,input$param2),r),
"X" = matrix(rchisq(input$n*r,input$param1),r),
"T" = matrix(rt(input$n*r,input$param1),r))

# It was very important to make sure that rv contained numeric values for plotting:
rv$sample <- as.numeric(my.samples[1,])
rv$all.sums <- as.numeric(apply(my.samples,1,sum))
rv$all.means <- as.numeric(apply(my.samples,1,mean))
rv$all.vars <- as.numeric(apply(my.samples,1,var))
}
)

output$plotSample <- renderPlot({
# Plot only when user input is submitted by clicking "Sample Now"
if (input$takeSample) {
# Create a 2x2 plot area & leave a big space (5) at the top for title
par(mfrow=c(2,2), oma=c(0,0,5,0))
hist(rv$sample, main="Distribution of One Sample",
ylab="Frequency",col=1)
hist(rv$all.sums, main="Sampling Distribution of the Sum",
ylab="Frequency",col=2)
hist(rv$all.means, main="Sampling Distribution of the Mean",
ylab="Frequency",col=3)
hist(rv$all.vars, main="Sampling Distribution of the Variance",
ylab="Frequency",col=4)
mtext("Simulation Results", outer=TRUE, cex=3)
}
}, height=660, width=900) # end plotSample

} # end server

To leave a comment for the author, please follow the link and comment on their blog: Quality and Innovation » R.

R-bloggers.com offers daily e-mail updates about R news and tutorials on topics such as: Data science, Big Data, R jobs, visualization (ggplot2, Boxplots, maps, animation), programming (RStudio, Sweave, LaTeX, SQL, Eclipse, git, hadoop, Web Scraping) statistics (regression, PCA, time series, trading) and more...

Using Apache SparkR to Power Shiny Applications: Part I

$
0
0

(This article was first published on Emaasit's Blog » R, and kindly contributed to R-bloggers)

This post was first published on SparkIQ Labs’ blog and re-posted on my personal blog.

shiny-sparkr

Introduction

The objective of this blog post is demonstrate how to use Apache SparkR to power Shiny applications. I have been curious about what the use cases for a “Shiny-SparkR” application would be and how to develop and deploy such an app.

SparkR is an R package that provides a light-weight frontend to use Apache Spark from R. SparkR provides a distributed data frame implementation that supports operations like selection, filtering, aggregation etc. (similar to R data frames, dplyr) but on large datasets. SparkR also supports distributed machine learning using MLlib.

Shiny is an open source R package that provides an elegant and powerful web framework for building web applications using R. Shiny helps you turn your analyses into interactive web applications without requiring HTML, CSS, or JavaScript knowledge.

Use Cases

So you’re probably asking yourself, “Why would I need to use SparkR to run my Shiny applications?”. That is a legitimate question and to answer it, we need to understand the different classes of big data problems.

Classes of Big Data Problems
In a recent AMA on Reddit, Hadley Wickham (Chief Scientist at RStudio) painted a clearer picture of how “Big Data” should be defined. His insights will help us to define uses cases for SparkR and Shiny.

I believe big data problems should be categorized in 3 main classes:

  1. Big Data-Small Analytics: This is where a data scientist begins with a raw big dataset and then slices and dices that data to obtain the right sample required to answer a specific business/research problem. In most cases the resulting sample is a small dataset, which doesnot require the use of SparkR to run a shiny application.
  2. Partition Aggregrate Analytics: This is where a data scientist needs to distribute and parallelize computation over multiple machines. Wickham defines this problem as a trivially parallelisable problem. An example is when you need to fit one model per individual for thousands of individuals. In this case SparkR is a good fit but there are also packages in R that solve this problem such as the foreach package.
  3. Big Data-Large Scale Analytics. This is where a data scientist needs all the big data, perhaps because they are fitting a complex model. An example of this type of problem is recommender systems which really do benefit from lots of data because they need to recognize interactions that occur only rarely. SparkR is a perfect fit for this problem when developing Shiny applications.

Memory Considerations

Also, it’s important to take into consideration memory availability and size when looking into such an application. This can be viewed in two different ways:

  • If you are running your shiny applications on servers that have more than enough memory to fit your big data, then you probrably do not need SparkR. Nowadays there is accessibility to machines with terabytes on RAM from cloud providers like Amazon AWS.
  • If your big data cannot fit on one machine, you may need to distribute it on several machines. SparkR is a perfect fit for this problem because it provides distributed algorithms that can crunch your data on different worker nodes and return the result to the master node.

A Simple Illustrative Example

Before we start understanding how each piece of such an application would operate, let’s download and run this simple Shiny-SparkR application. Go to this github repository https://github.com/SparkIQ-Labs/Demos and access the “shiny-sparkr-demo-1” example.

Repository

Prerequisites

  1. Make sure you already have Apache Spark 1.5 or later downloaded onto your computer. Instructions for downloading and starting SparkR can be found in this blog post.
  2. Make sure you have Java 1.7.x installed and the environment variables are set.

Launch the App

Once you have downloaded the app-folder, open the project in RStudio and open the “server.R” file.

    1. Change Spark Home. Change the path of the SPARK_HOME environment variable to point to the destination of your Spark installation.

Change Spark home

  1. Run the App. Run the shiny app by using this command shiny::runApp(). It will take some time for SparkR to be initialized before you can see the results of the underlying analysis are displayed.

The App

Here is the the code for the “server.R” file.

 What happens Underneath.

    1. Stage 1: When you run the app, the user interface is displayed but without the rendered text output or model summary.

App without the results

    1. Stage 2: Meanwhile, in the background on your computer node(s), java is launched using the Spark-submit file, then the SparkR library is loaded and then SparkR is initialized.

SparkR is initialized

    1. Stage 3: SparkR commands in the Server.R file are then executed, which finally shows the output within the shiny app.

Results in the App

You can use the Spark UI to check the jobs that were completed, in the event timeline, to produce the final results in the shiny app. Go to localhost and listen on port 4040.

Results in the App

  1. Stage 4: When you change the input values in the app and click the “Predict Sepal Length” button, the application uses the already exciting Spark Context to run the predict function and displays the predicted value. This operations takes a shorter time than the initial launch of the shiny app.

Change values

Moving Forward

The objective of this first demo was to learn the use cases for SparkR and Shiny; and to see what happens underneath when you eventually deploy and run such an application on a PC.

In Part II of this tutorial series, we shall see how to develop and deploy such an application for a “Big Data-Large Scale Analytics” problem on big data stored on a cluster on AWS EC2. As we have already established this is one of the perfect use cases for SparkR and Shiny.

Please share your thoughts and experiences in the comments’ section below if you have built such applications.


Tagged: Apache Spark, Big Data, R, RStudio, Shiny, SparkR

To leave a comment for the author, please follow the link and comment on their blog: Emaasit's Blog » R.

R-bloggers.com offers daily e-mail updates about R news and tutorials on topics such as: Data science, Big Data, R jobs, visualization (ggplot2, Boxplots, maps, animation), programming (RStudio, Sweave, LaTeX, SQL, Eclipse, git, hadoop, Web Scraping) statistics (regression, PCA, time series, trading) and more...

Build Online Image Classification Service with Shiny and MXNetR

$
0
0

(This article was first published on DMLC(distributed machine learning common), and kindly contributed to R-bloggers)

Early this week, Google announced its Cloud Vision API, which can detect the content of an image.

With the power of R and MXNet, you can try something very similar on your own laptop: an image classification shiny app.
Thanks to the powerful shiny framework, it is implemented with no more than 150 lines of R code.

center

Installing mxnet package

Due to various reasons, mxnet package can't get on cran, but we try our best to make installation process easy.

For Windows and Mac users, you can install CPU-version of mxnet in R directly using the following code:

install.packages("drat", repos="https://cran.rstudio.com")
drat:::addRepo("dmlc")
install.packages("mxnet")

If you want to use the power of your GPU or you are a Linux hacker, please follow the link.

Run the shiny app

Besides the mxnet, you will also need shiny for the web framework and imager for image preprocessing. Both of them are on CRAN, so you can install them easily.

install.packages("shiny", repos="https://cran.rstudio.com")
install.packages("imager", repos="https://cran.rstudio.com")

The hardest part has been done if you finish all the installation.
Let's run the app and have fun!
You can clone the repo or just use the line of code below in R.

shiny::runGitHub("thirdwing/mxnet_shiny")

For the first time, it will take some time to download a pre-trained Inception-BatchNorm Network (you can know more details on network architecture from the paper). And then you can use your local figures or a url containing figure. Personally I think the result is quite good.

center

Code behind the app

You can find all the code from the repo.
Just like other shiny apps, we have ui.R and server.R. The ui.R is quite straightforward, we just define a sidebarPanel and a mainPanel.

Let's look into the server.R. All the web-related things are nicely handled by shiny. Besides that, there are 3 chunks of code.

First, we load the pre-trained model:

model <<- mx.model.load("Inception/Inception_BN", iteration = 39)
synsets <<- readLines("Inception/synset.txt")
mean.img <<- as.array(mx.nd.load("Inception/mean_224.nd")[["mean_img"]])

Then we defined a function to preprocess figures:

preproc.image <- function(im, mean.image) {
  # crop the image
  shape <- dim(im)
  short.edge <- min(shape[1:2])
  yy <- floor((shape[1] - short.edge) / 2) + 1
  yend <- yy + short.edge - 1
  xx <- floor((shape[2] - short.edge) / 2) + 1
  xend <- xx + short.edge - 1
  croped <- im[yy:yend, xx:xend,,]
  # resize to 224 x 224, needed by input of the model.
  resized <- resize(croped, 224, 224)
  # convert to array (x, y, channel)
  arr <- as.array(resized)
  dim(arr) = c(224, 224, 3)
  # substract the mean
  normed <- arr - mean.img
  # Reshape to format needed by mxnet (width, height, channel, num)
  dim(normed) <- c(224, 224, 3, 1)
  return(normed)
}

Last, we read the figure and make prediction:

im <- load.image(src)
normed <- preproc.image(im, mean.img)
prob <- predict(model, X = normed)
max.idx <- order(prob[,1], decreasing = TRUE)[1:5]
result <- synsets[max.idx]

If you met any problem, please just open an issure. Any PR will be truly appreciated!
If you find really interesting results, share it on Twitter with #MXnet!

center

I know it is not a Chihuahua, but very close.

center

A photo in my phone and just try yours!

To leave a comment for the author, please follow the link and comment on their blog: DMLC(distributed machine learning common).

R-bloggers.com offers daily e-mail updates about R news and tutorials on topics such as: Data science, Big Data, R jobs, visualization (ggplot2, Boxplots, maps, animation), programming (RStudio, Sweave, LaTeX, SQL, Eclipse, git, hadoop, Web Scraping) statistics (regression, PCA, time series, trading) and more...

A Discrete Time Markov Chain (DTMC) SIR Model in R

$
0
0

(This article was first published on Quality and Innovation » R, and kindly contributed to R-bloggers)
Image Credit: Doug Buckley of http://hyperactive.to

Image Credit: Doug Buckley of http://hyperactive.to

There are many different techniques that be used to model physical, social, economic, and conceptual systems. The purpose of this post is to show how the Kermack-McKendrick (1927) formulation of the SIR Model for studying disease epidemics (where S stands for Susceptible, I stands for Infected, and R for Recovered) can be easily implemented in R as a discrete time Markov Chain using the markovchain package.

A Discrete Time Markov Chain (DTMC) is a model for a random process where one or more entities can change state between distinct timesteps. For example, in SIR, people can be labeled as Susceptible (haven’t gotten a disease yet, but aren’t immune), Infected (they’ve got the disease right now), or Recovered (they’ve had the disease, but no longer have it, and can’t get it because they have become immune). If they get the disease, they change states from Susceptible to Infected. If they get well, they change states from Infected to Recovered. It’s impossible to change states between Susceptible and Recovered, without first going through the Infected state. It’s totally possible to stay in the Susceptible state between successive checks on the population, because 

Discrete time means you’re not continuously monitoring the state of the people in the system. It would get really overwhelming if you had to ask them every minute “Are you sick yet? Did you get better yet?” It makes more sense to monitor individuals’ states on a discrete basis rather than continuously, for example, like maybe once a day. (Ozgun & Barlas (2009) provide a more extensive illustration of the difference between discrete and continuous modeling, using a simple queuing system.)

To create a Markov Chain in R, all you need to know are the 1) transition probabilities, or the chance that an entity will move from one state to another between successive timesteps, 2) the initial state (that is, how many entities are in each of the states at time t=0), and 3) the markovchain package in R. Be sure to install markovchain before moving forward.

Imagine that there’s a 10% infection rate, and a 20% recovery rate. That implies that 90% of Susceptible people will remain in the Susceptible state, and 80% of those who are Infected will move to the Recovered Category, between successive timesteps. 100% of those Recovered will stay recovered. None of the people who are Recovered will become Susceptible.

Say that you start with a population of 100 people, and only 1 is infected. That means your “initial state” is that 99 are Susceptible, 1 is Infected, and 0 are Recovered. Here’s how you set up your Markov Chain:

library(markovchain)
mcSIR <- new("markovchain", states=c("S","I","R"),
    transitionMatrix=matrix(data=c(0.9,0.1,0,0,0.8,0.2,0,0,1),
    byrow=TRUE, nrow=3), name="SIR")
initialState <- c(99,0,1)

At this point, you can ask R to see your transition matrix, which shows the probability of moving FROM each of the three states (that form the rows) TO each of the three states (that form the columns).

> show(mcSIR)
SIR
 A  3 - dimensional discrete Markov Chain with following states
 S I R 
 The transition matrix   (by rows)  is defined as follows
    S   I   R
S 0.9 0.1 0.0
I 0.0 0.8 0.2
R 0.0 0.0 1.0

You can also plot your transition probabilities:

plot(mcSIR,package="diagram")

dtmc-sir-transitionnetwork

But all we’ve done so far is to create our model. We haven’t yet done a simulation, which would show us how many people are in each of the three states as you move from one discrete timestep to many others. We can set up a data frame to contain labels for each timestep, and a count of how many people are in each state at each timestep. Then, we fill that data frame with the results after each timestep i, calculated by initialState*mcSIR^i:

timesteps <- 100
sir.df <- data.frame( "timestep" = numeric(),
 "S" = numeric(), "I" = numeric(),
 "R" = numeric(), stringsAsFactors=FALSE)
 for (i in 0:timesteps) {
newrow <- as.list(c(i,round(as.numeric(initialState * mcSIR ^ i),0)))
 sir.df[nrow(sir.df) + 1, ] <- newrow
 }

Now that we have a data frame containing our SIR results (sir.df), we can display them to see what the values look like:

> sir.df
    timestep  S  I   R
1          0 99  0   1
2          1 89 10   1
3          2 80 17   3
4          3 72 21   6
5          4 65 24  11
6          5 58 26  16
7          6 53 27  21
8          7 47 27  26
9          8 43 26  31
10         9 38 25  37
11        10 35 24  42
12        11 31 23  46
13        12 28 21  51
14        13 25 20  55
15        14 23 18  59
...

And then plot them to view our simulation results using this DTMC SIR Model:

plot(sir.df$timestep,sir.df$S)
points(sir.df$timestep,sir.df$I, col="red")
points(sir.df$timestep,sir.df$R, col="green")

dtmc-sir-simulation

It’s also possible to use the markovchain package to identify elements of your system as it evolves over time:

&g; absorbingStates(mcSIR)
[1] "R"
> transientStates(mcSIR)
[1] "S" "I"
> steadyStates(mcSIR)
     S I R
[1,] 0 0 1

And you can calculate the first timestep that your Markov Chain reaches its steady state (the “time to absorption”), which your plot should corroborate:

> ab.state  occurs.at  (sir.df[row,]$timestep)+1
[1] 58

You can use this code to change the various transition probabilities to see what the effects are on the outputs yourself (sensitivity analysis). Also, there are methods you can use to perform uncertainty analysis, e.g. putting confidence intervals around your transition probabilities. We won’t do either of these here, nor will we create a Shiny app to run this simulation, despite the significant temptation.

To leave a comment for the author, please follow the link and comment on their blog: Quality and Innovation » R.

R-bloggers.com offers daily e-mail updates about R news and tutorials on topics such as: Data science, Big Data, R jobs, visualization (ggplot2, Boxplots, maps, animation), programming (RStudio, Sweave, LaTeX, SQL, Eclipse, git, hadoop, Web Scraping) statistics (regression, PCA, time series, trading) and more...

Deploying Your Very Own Shiny Server

$
0
0

(This article was first published on Quality and Innovation » R, and kindly contributed to R-bloggers)

Nicole has been having a lot of fun the last few days creating her own Shiny apps. We work in the same space, and let’s just say her enthusiasm is very contagious. While she focused on deploying R-based web apps on ShinyApps.io, I’m more of a web development geek, so I put my energy towards setting up a server where she could host her apps. This should come in handy, since she blew through all of her free server time on ShinyApps after just a couple of days!

Before you begin, you can see a working example of this at https://shinyisat.net/sample-apps/sampdistclt/.

In this tutorial, I’m going to walk you through the process of:

  1. Setting up an Ubuntu 14.04 + NGINX server at DigitalOcean
  2. Installing and configuring R
  3. Installing and configuring Shiny and the open-source edition of Shiny Server
  4. Installing a free SSL certificate from Let’s Encrypt
  5. Securing the Shiny Server using the SSL cert and reverse proxy through NGINX
  6. Setting appropriate permissions on the files to be served
  7. Creating and launching the app Nicole created in her recent post

Setting Up an Ubuntu 14.04 Server at DigitalOcean

DigitalOcean is my new favorite web host. (Click this link to get a $10 credit when you sign up!) They specialize in high-performance, low-cost, VPS (virtual private servers) targeted at developers. If you want full control over your server, you can’t beat their $5/month offering. They also provide excellent documentation. In order to set up your server, you should start by following these tutorials:

  1. How to Create Your First DigitalOcean Droplet Virtual Server
  2. How to Connect to Your Droplet with SSH
  3. Initial Server Setup with Ubuntu 14.04
  4. Additional Recommended Steps for New Ubuntu 14.04 Servers
  5. How To Protect SSH with Fail2Ban on Ubuntu 14.04

I followed these pretty much exactly without any difficulties. I did make a few changes to their procedure, which I’ll describe next.

Allowing HTTPS with UFW

I found that the instructions for setting up ufw needed a tweak. Since HTTPS traffic uses port 443 on the server, I thought that sudo ufw allow 443/tcp should take care of letting HTTPS traffic through the firewall. Unfortunately, it doesn’t. In addition you should run the following:


$ sudo ufw allow https

$ sudo ufw enable

Your web server may not accept incoming HTTPS traffic if you do not do this. Note: you may not have noticed, but you also installed NGINX as part of the UFW tutorial.

Setting up Automatic Updates on Your Server

The default install of Ubuntu at DigitalOcean comes with the automatic updates package already installed. This means your server will get security packages and upgrades without you having to do it manually. However, this package needs to be configured. First, edit /etc/apt/apt.conf.d/50unattended-upgrades to look like this:

Unattended-Upgrade::Allowed-Origins {
   "${distro_id}:${distro_codename}-security";
   "${distro_id}:${distro_codename}-updates";
};
Unattended-Upgrade::Mail "admin@mydomain.com";
Unattended-Upgrade::Remove-Unused-Dependencies "true";
Unattended-Upgrade::Automatic-Reboot "true";
Unattended-Upgrade::Automatic-Reboot-Time "02:00";

Note, that this configuration will install upgrades and security updates, and will automatically reboot your server, if necessary, at 2:00AM, and it will purge unused packages from your system completely. Some people don’t like to have that much stuff happen automatically without supervision. Also, my /etc/apt/apt.conf.d/10periodic file looks like:

APT::Periodic::Update-Package-Lists "1";
APT::Periodic::Download-Upgradeable-Packages "1";
APT::Periodic::AutocleanInterval "7";
APT::Periodic::Unattended-Upgrade "1";

Which sets upgrades to happen daily, and purges to happen once a week.

Installing and Configuring R

Okay, now that your server is set up (you should be able to view the default NGINX page at http://your-domain-name.com), it’s time to install R.

Set the CRAN Repository in Ubuntu’s sources.list

The first step is to add your favorite CRAN repository to Ubuntu’s sources list. This will ensure that you get the latest version of R when you install it. To open and edit the sources list, type the following:


$ sudo nano /etc/apt/sources.list

Move the cursor down to the bottom of this file using the arrow keys, and add the following line at the bottom:


deb https://cran.cnr.berkeley.edu/bin/linux/ubuntu trusty/

Of course, you can substitute your favorite CRAN repo here. I like Berkeley. Don’t miss that there is a space between “ubuntu” and “trusty”. Hit CTRL+x to exit from this file. Say “yes” when they ask if you want to save your changes. The official docs on installing R packages on Ubuntu also recommend that you activate the backports repositories as well, but I found that this was already done on my DigitalOcean install.

Add the Public Key for the Ubuntu R Package

In order for Ubuntu to be able to recognize, and therefore trust, download, and install the R packages from the CRAN repo, we need to install the public key. This can be done with the following command:


$ sudo apt-key adv --keyserver keyserver.ubuntu.com --recv-keys 51716619E084DAB9

Install R

Run the following:


$ sudo apt-get update

$ sudo apt-get install r-base

When this is finished, you should be able to type R –version and get back the following message:


$ R --version

R version 3.2.2 (2015-08-14) -- "Fire Safety"
Copyright (C) 2015 The R Foundation for Statistical Computing
Platform: x86_64-pc-linux-gnu (64-bit)

R is free software and comes with ABSOLUTELY NO WARRANTY.
You are welcome to redistribute it under the terms of the
GNU General Public License versions 2 or 3.
For more information about these matters see
http://www.gnu.org/licenses/.

If you get this, you’ll know that R was successfully installed on your server. If not, you’ll need to do some troubleshooting.

Configure R to Use curl and Your CRAN Repository of Choice

Type the following to open up the Rprofile.site file:


$ sudo pico /etc/R/Rprofile.site

You may delete all of the content and add the following:


options(download.file.method="libcurl")

local({
    r <- getOption("repos")
    r["CRAN"] <- "https://cran.rstudio.com/"
    options(repos=r)
})

This will allow us to run install.packages('packagename') without specifying the repository later.

Install Dependencies and Packages Needed by Shiny Server

We’re going to need the devtools package, which means we need to install the libraries upon which it depends first (libcurl and libxml2):


$ sudo apt-get -y build-dep libcurl4-gnutls-dev

$ sudo apt-get -y install libcurl4-gnutls-dev

$ sudo apt-get -y build-dep libxml2-dev

$ sudo apt-get -y install libxml2-dev

Now we can install devtools, rsconnect, and rmarkdown:


$ sudo su - -c "R -e "install.packages('devtools')""

$ sudo su - -c "R -e "devtools::install_github('rstudio/rsconnect')""

$ sudo su - -c "R -e "install.packages('rmarkdown')""

$ sudo su - -c "R -e "install.packages('shiny')""

Install Shiny Server

Okay! Now we’re finally ready to install Shiny Server. Run the following:


$ cd ~ 
$ sudo apt-get install gdebi-core
$ wget https://download3.rstudio.org/ubuntu-12.04/x86_64/shiny-server-1.4.1.759-amd64.deb
$ sudo gdebi shiny-server-1.4.1.759-amd64.deb

At this point, your Shiny Server should be up and running, but we can’t visit it on the web yet because by default, it runs on port 3838, which is blocked by the firewall we set up earlier. We’re now going to secure it, and use a reverse proxy to run it through NGINX.

Install an SSL Certificate with Let’s Encrypt

Let’s Encrypt is a new, free service that will allow you to install a trusted SSL certificate on your server. Since Google and Mozilla are working hard to phase out all non-HTTPS traffic on the web, it’s a good idea to get into the habit of installing SSL certs whenever you set up a new website. First install git, then use it to download letsencrypt:


$ sudo apt-get install git
$ git clone https://github.com/letsencrypt/letsencrypt
$ cd letsencrypt

Now before we install the certificate, we have to stop our web server (NGINX). In the code below, replace yourdomain.com with your actual domain name that you registered for this site.


$ sudo service nginx stop
$ sudo ./letsencrypt-auto certonly --standalone -d yourdomain.com -d www.yourdomain.com

If all goes well, it should have installed your new certificates in the /etc/letsencrypt/live/yourdomain.com folder.

Configure the Reverse Proxy on NGINX

Open up the following file for editing:


$ sudo nano /etc/nginx/nginx.conf

And add the following lines near the bottom of the main http block, just before the section labeled “Virtual Host Configs”. In my file, this started around line 62:


...

##
# Map proxy settings for RStudio
##
map $http_upgrade $connection_upgrade {
    default upgrade;
    '' close;
}

##
# Virtual Host Configs
##
...

And then open up the default site config file:


$ sudo nano /etc/nginx/sites-available/default

And replace its contents with the following. Note you should replace yourdomain.com with your actual domain name, and 123.123.123.123 with the actual IP address of your server.


server {
   listen 80 default_server;
   listen [::]:80 default_server ipv6only=on;
   server_name yourdomain.com www.yourdomain.com;
   return 301 https://$server_name$request_uri;
}
server {
   listen 443 ssl;
   server_name yourdomain.com www.yourdomain.com;
   ssl_certificate /etc/letsencrypt/live/yourdomain.com/fullchain.pem;
   ssl_certificate_key /etc/letsencrypt/live/yourdomain.com/privkey.pem;
   ssl_protocols TLSv1 TLSv1.1 TLSv1.2;
   ssl_prefer_server_ciphers on;
   ssl_ciphers AES256+EECDH:AES256+EDH:!aNULL;

   location / {
       proxy_pass http://123.123.123.123:3838;
       proxy_redirect http://123.123.123.123:3838/ https://$host/;
       proxy_http_version 1.1;
       proxy_set_header Upgrade $http_upgrade;
       proxy_set_header Connection $connection_upgrade;
       proxy_read_timeout 20d;
   }
}

Now start NGINX up again:


$ sudo service nginx start

And if all went well, your new Shiny Server should be up and running at https://yourdomain.com!

Note that even if you try to go to the insecure URL, traffic will be automatically redirected through HTTPS.

Setting Appropriate Permissions

Sometimes, your Shiny apps will need access to the filesystem to read or write files. Since the Shiny server runs as the user shiny, and since all the files that are being served are owned by root, then your apps will crash when they try to access files. I like Dean Attali’s solution. Run the following commands, substituting yourusername with the username you are using to access the server:


$ sudo groupadd shiny-apps
$ sudo usermod -aG shiny-apps yourusername
$ sudo usermod -aG shiny-apps shiny
$ cd /srv/shiny-server
$ sudo chown -R yourusername:shiny-apps .
$ sudo chmod g+w .
$ sudo chmod g+s .

In the future, any time you add files under /srv/shiny-server, you may need to change the permissions so the Shiny server can read them. We’ll do that in a moment.

Installing a New App

Finally, I’m going to show you how to put a new app on the server. We’re going to use the app that Nicole created and add it into the “sample apps” folder. Run the following:


$ cd /srv/shiny-server/sample-apps
$ mkdir sampdistclt
$ cd sampdistclt
$ nano server.R

This will create a new file called server.R and open it for editing. Copy and paste the second half of the code from Nicole’s post (the part that starts with ## server) into this file. Save and exit. Now create a second file in this directory called ui.R and paste the code from the first half of Nicole’s post (the part that starts with ## ui up to but not including the part that starts ## server). Save and exit.

Now you need to make sure that the permissions are set correctly:


$ chown -R :shiny-apps .

You may also need to restart the Shiny and/or NGINX servers. The commands to do that are:


$ sudo service nginx restart
$ sudo service shiny-server restart

If all has gone well, you can now view the app up and running at https://yourdomain.com/sample-apps/sampdistclt!

Conclusion

I haven’t had a lot of time to use this configuration, so please let me know if you find any bugs, or things that need to be tweaked. On the plus side, this configuration may be cheaper than using ShinyApps.io, but it also doesn’t have all the cool bells and whistles that you get there, either, like their user interface and monitoring traffic. At the very least, it should be a way to experiment, and put things out in the public for others to play with. Enjoy!

To leave a comment for the author, please follow the link and comment on their blog: Quality and Innovation » R.

R-bloggers.com offers daily e-mail updates about R news and tutorials on topics such as: Data science, Big Data, R jobs, visualization (ggplot2, Boxplots, maps, animation), programming (RStudio, Sweave, LaTeX, SQL, Eclipse, git, hadoop, Web Scraping) statistics (regression, PCA, time series, trading) and more...
Viewing all 673 articles
Browse latest View live